Many users are getting the “401: Unauthorized” error when embedding Grafana into an iframe card.
The community suggests adding GF_AUTH_ANONYMOUS_ENABLED or GF_SECURITY_ALLOW_EMBEDDING to Grafana configration, but this did not solve the problem in my environment.
Finally, I found another solution and I’ll share it with the community.
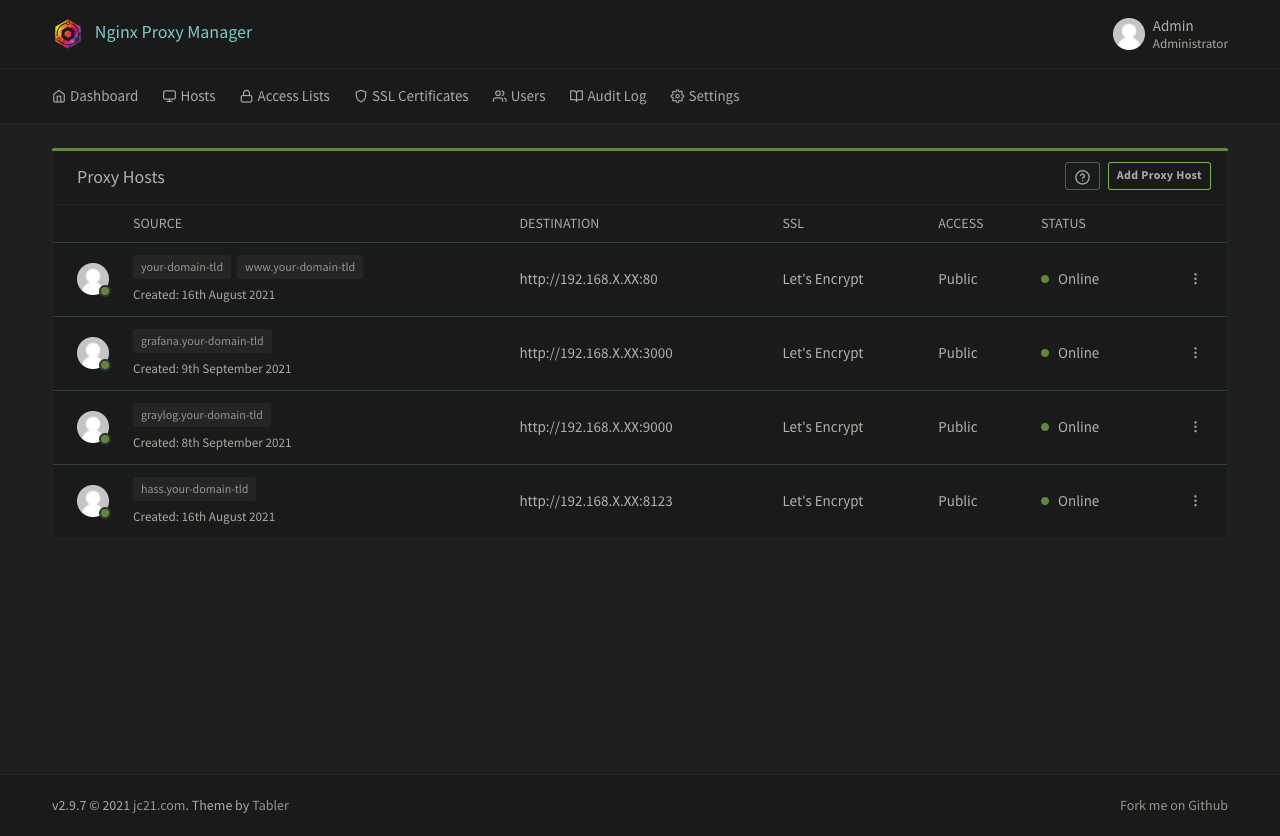
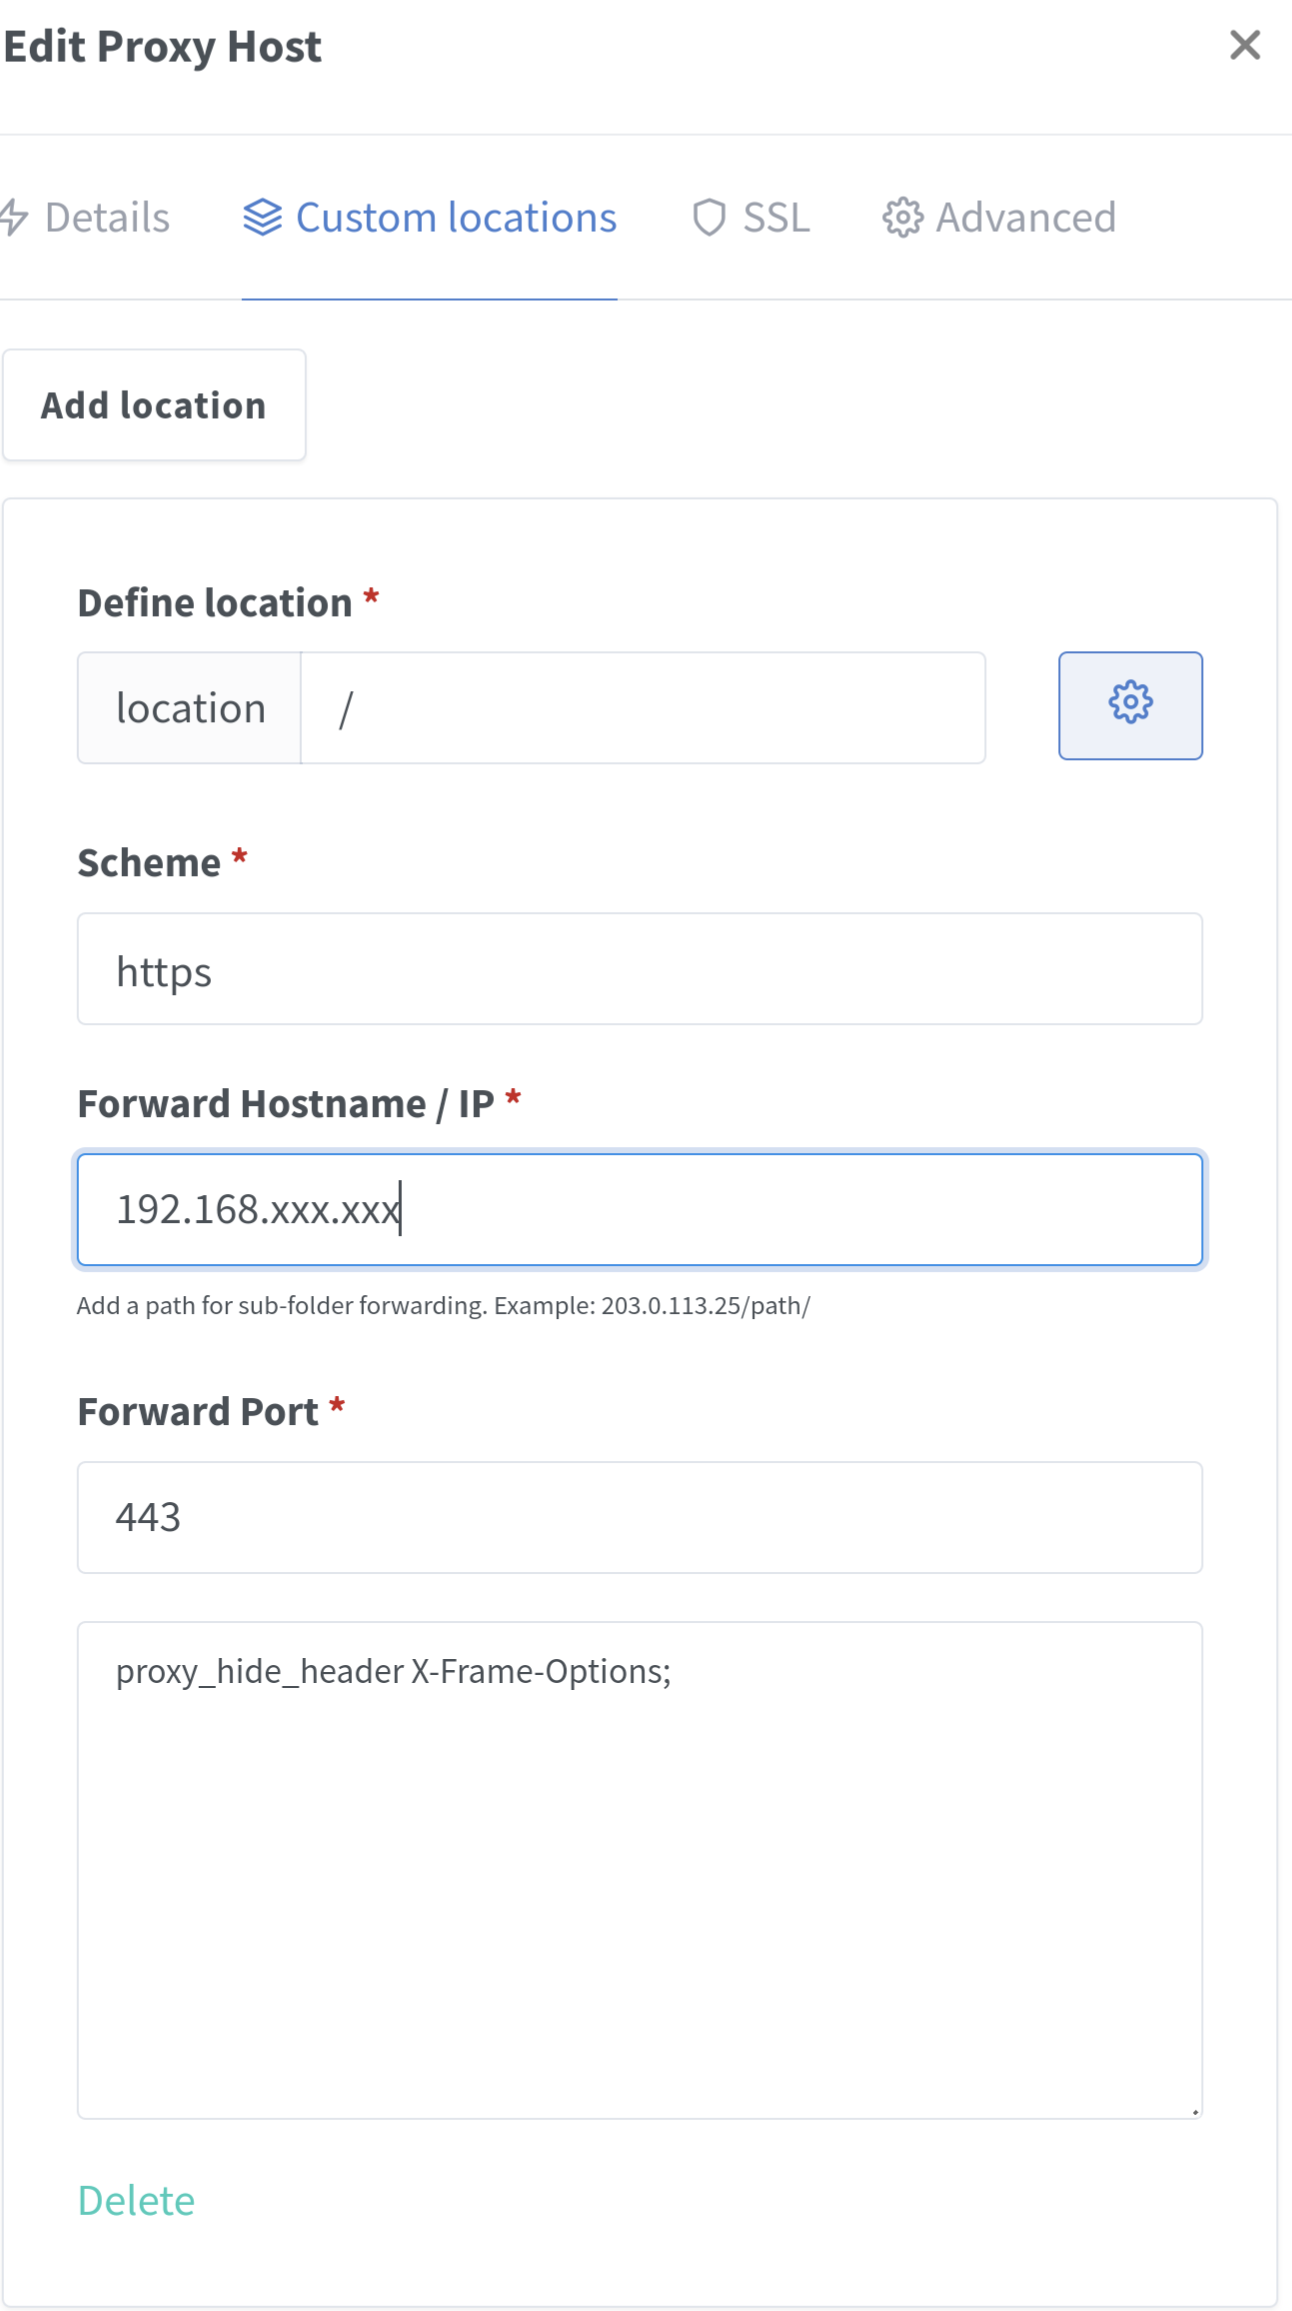
In my environment, I use Nginx Proxy Manager, Let’s Encrypt, Google Cloud DNS, and Home Assistant OS, but I think this method will work for other DNS services and reverse proxy based environments.
Thank you for taking the time to explain this process in detail!
Did you manage to change the default admin password, or did you just delete that user? (as it doesn’t appear in the screenshots). Cheers!
Hello @kojirof i have tested your solution but the link is ok with direct link but not with iframe .
The page still request username and password…
The login is work but the page return on login screen.
How to fix this issue??
Regards
It does not solve it for me. I honestly do not know why your approach would change anything. I am using Homa Assistant on my domain, hosted on my synology NAS. The only difference is that I created another subdomain for grafana. The result is understandably the same. 401 unauthorized. There should be some configuration in grafana itself.
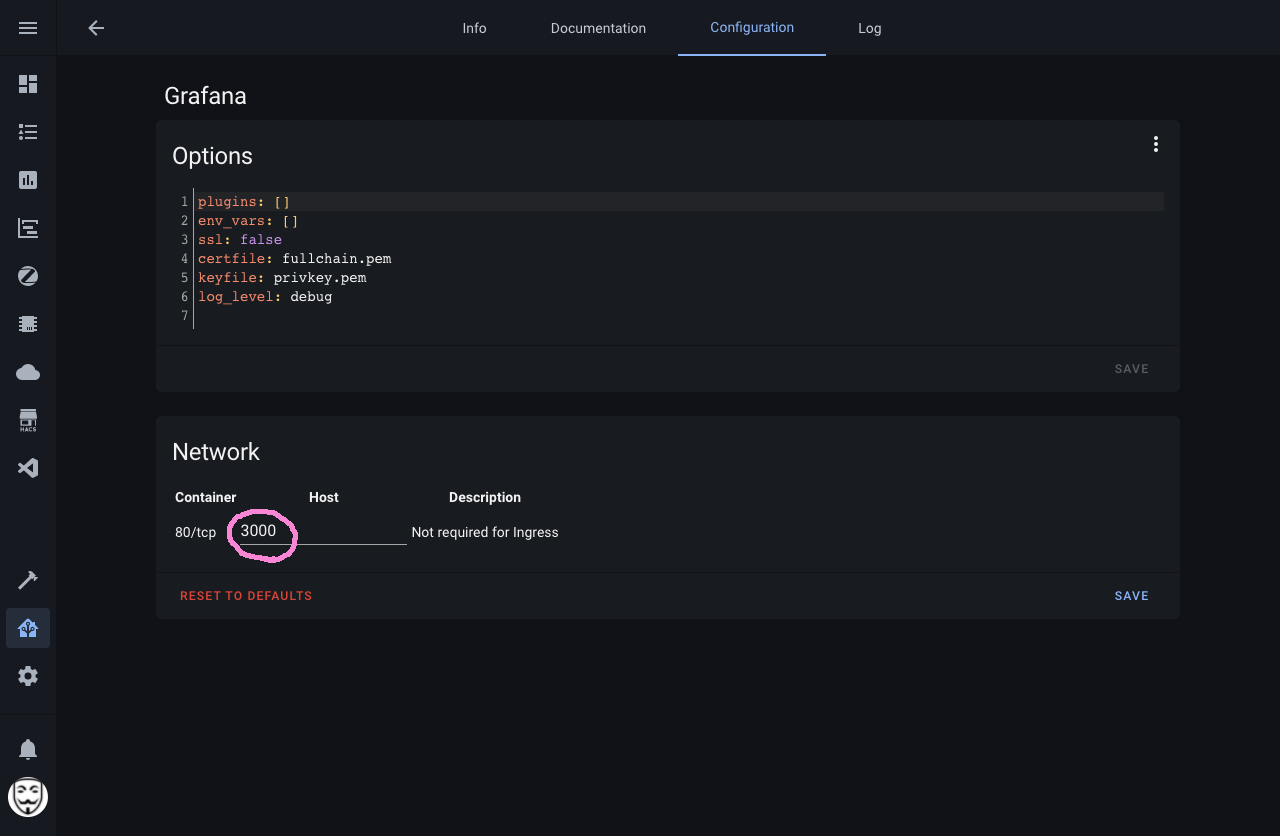
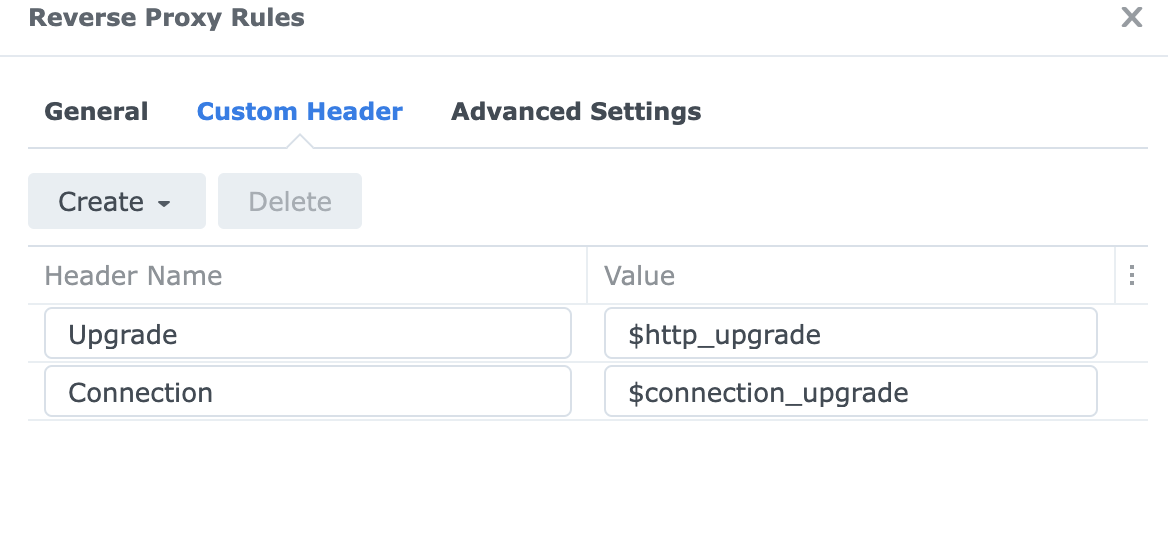
I have grafana on my subdomain and running on port 3000 as everybody around try as well. I use reverse proxy on my synology nas to point to that domain, to be out of home assistant. I do not get 401 but just a white blank window now.
You’ll have to look up the Synology container you are using for proxy and follow the documentation.
I use the Nginx Proxy Manager add-on which I’ve described above. I could tell you how to do it on. Apache or Tomcat as well. But Synology isn’t something I use.
X-frame-options however is used by every modern browser, and where your issue lies trying to render another fqdn site within an fqdn. So it is solvable… I just don’t know Synology reverse proxy
That is normal. IP addresses are not fully qualified domain names. So they render fine.
Most public sites facing the world use fqdn not IP, and all modern browsers block cross-site scripting so that people can’t render someone else’s site inside of theirs say fake rendering objects from a bank login page on your fake site.
You’ll need to drop the x-frame-options header between your proxy and backend to render the iframe across a fqdn
There is another way to solve this problem. It works for me, but it doesn’t work when I’m connected over nabu casa.
I’m using ssl cert and nginx but just for local connection. For remote connection I use nabu casa.
In grafana I use port 8182. I have also some env variables but I don’t think it’s related to this. But this is it
Then you only open 80 and 443, 80 to rewrite to 443.
Then you won’t need to port forward other ports like you do for graphana
Use Adguard or other dns server and make dns rewrites so
create your external dns record
create NPM proxy host yourdomain → your host:8182
in Adguard or local dns, make a dns rewrite so the dns rewrite points to NPM https://graphana.yourdomain → NPM internal IP address
Now when you are on your home network or out in the world you can use the same URL which also means your iframe will render wherever too. Ie you don’t need two separate iframe entries for external vs internal url
PiHole can do dns rewrites for you. So you can do dns rewrites with it.
NPM, Nginx Proxy Manager in the community add-on store
It’s an all in one add on for proxy management and certificate renewal through letsencrypt… the proxy serves the SSL and auto renews, so you don’t have to generate certificates and manually add them to the configuration of every add on you’d like to serve over ssl