I created the Energy Entity Card to fill a feature gap when setting up custom energy dashboards. While the built in power cards along with things like the Sankey Chart Card all link up and follow the date range set by the energy-date-selection, I couldn’t find a simple card that could do the same. Hence the creation of this one!
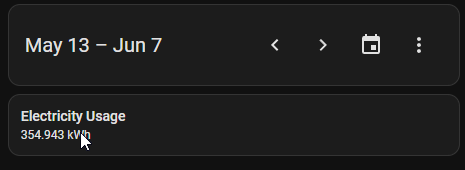
Right now the card is super simple. You just set an entity (optionally name/unit) and it’ll show the current figure for it based on what’s selected by the energy-date-selection card.
You can then add as many or as few of these to your dashboard as you like, mixing and matching them with other energy-date-selection aware cards.
As a small bonus feature, the card will work with any entity that supports home assistant statistics, so for example you could use it to see how many steps you did in a day/date range or anything else you can think up.
If this sounds useful at all to you, I’d love to get some feedback/thoughts on building it out further.
Thanks so much, Carl! This is exactly what I was looking for to be able to capture energy data outside of the energy dashboard, but able to use the energy date selection to define dynamic time frames. It works very well as is. Possible further enhancements might be to be able to control the output formats to allow placing the value & units to the right of the entity card name in addition to directly below for more layout flexibility. Thanks!
Hi Carl
Thank you for your card, but I would like to as for help.
How can I connect your card entity to custom cards, like Apex card ?
What will be the entity, so I would be able to get a selected date ?
Thank you very much
Nice card! I was looking for something like this. Would be nice if we could add icons to entities?And I am curious how you use the dates from the energy-date-selection?