Advanced History – a more powerful Home Assistant History panel / More-Info dialog. (uses the excellent Statistics Graph Chart Card for graph rendering)

Hi everyone,

I’ve been working on a custom integration called Advanced History.

It provides a dedicated Home Assistant History-style page, but uses the excellent Statistics Graph Chart Card for graph rendering.

Why I created it

Home Assistant’s built-in History page is very convenient for quickly selecting entities and viewing their history, but its graph customization is intentionally limited.

Statistics Graph Chart Card provides much more control over graph appearance and behavior, but normally requires cards to be configured on a dashboard beforehand.

Advanced History brings the two approaches together:

  • select areas, devices, or entities like the native History page;
  • choose a date range using Home Assistant’s Energy controls;
  • then display the results using the more configurable Statistics Graph Chart Card.

Main features

  • Native Home Assistant target picker
  • Select multiple areas, devices, and entities
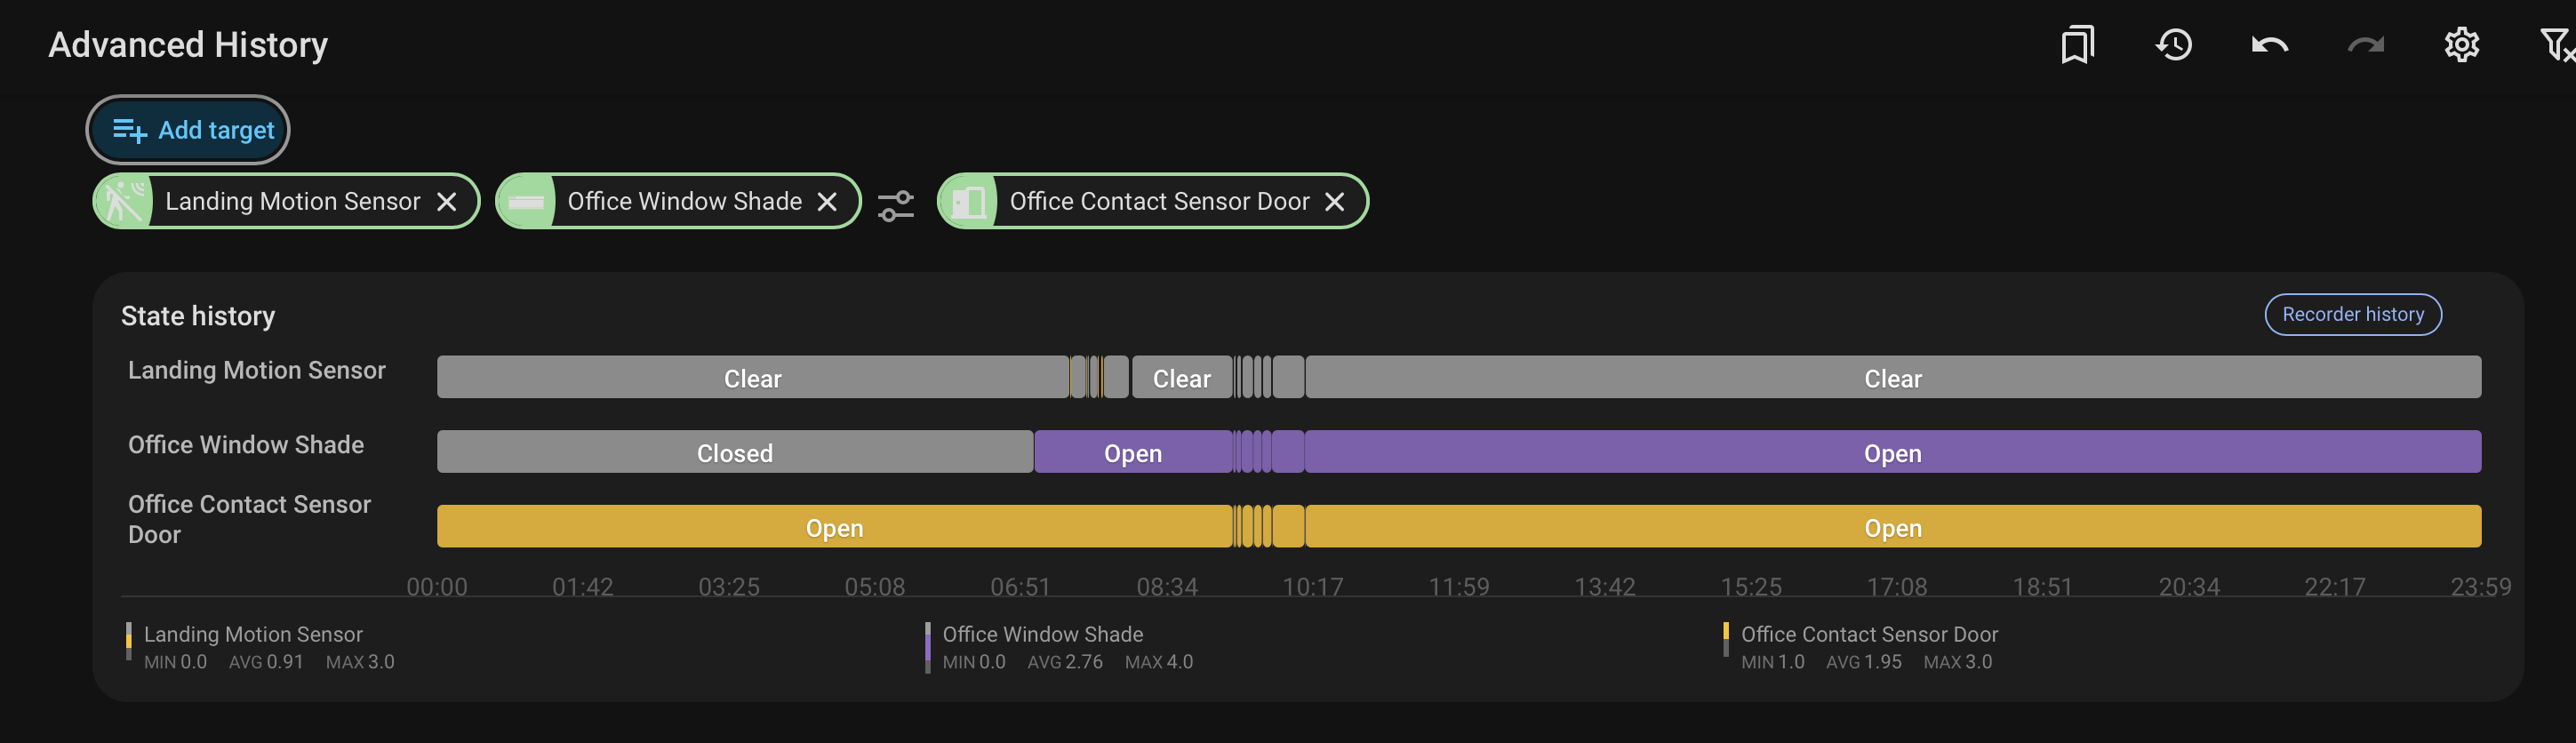
  • Automatic numeric-history and state-timeline graphs
  • Area names added to duplicate entity names where needed
  • Floating Energy-style date navigation
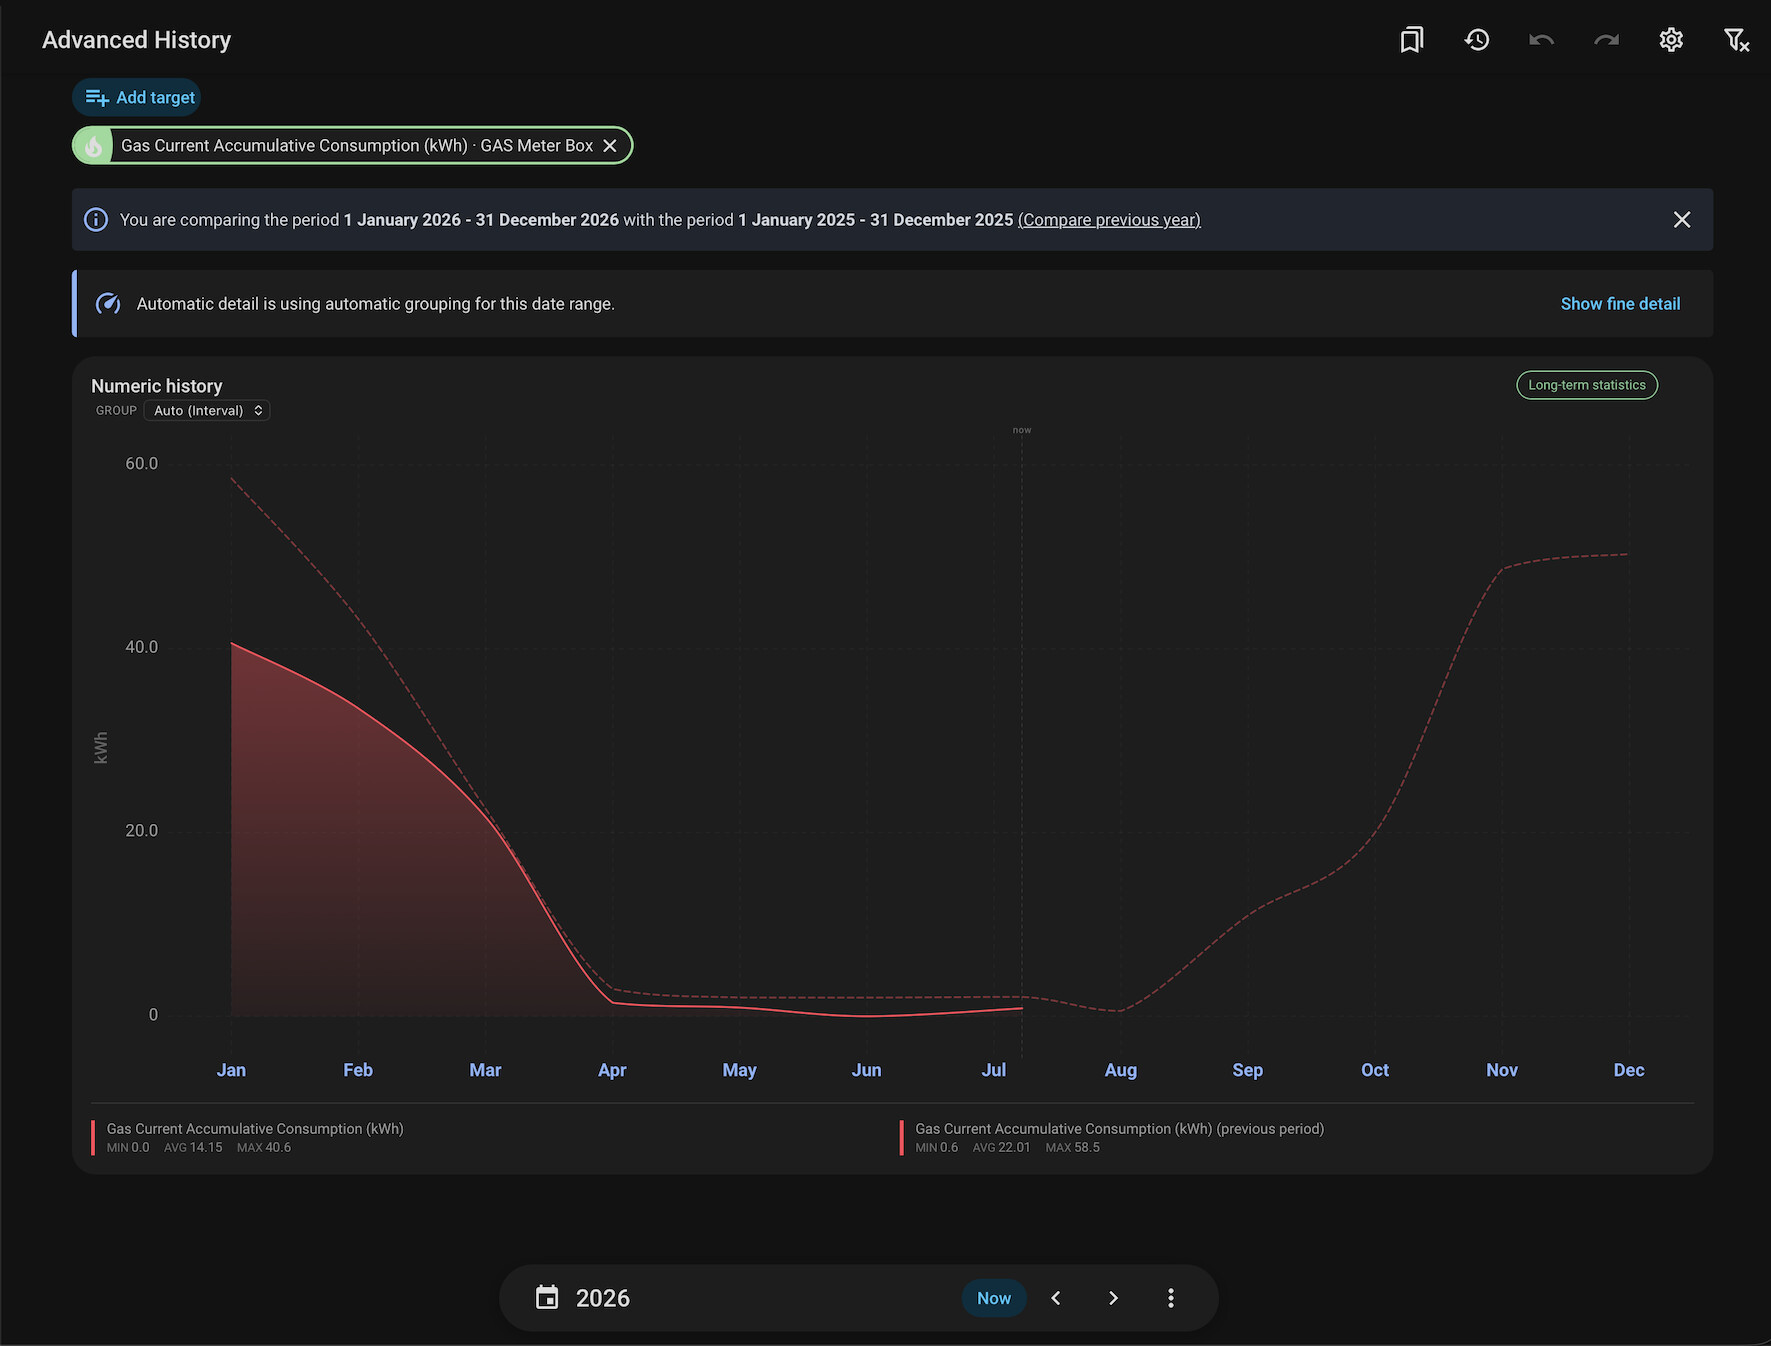
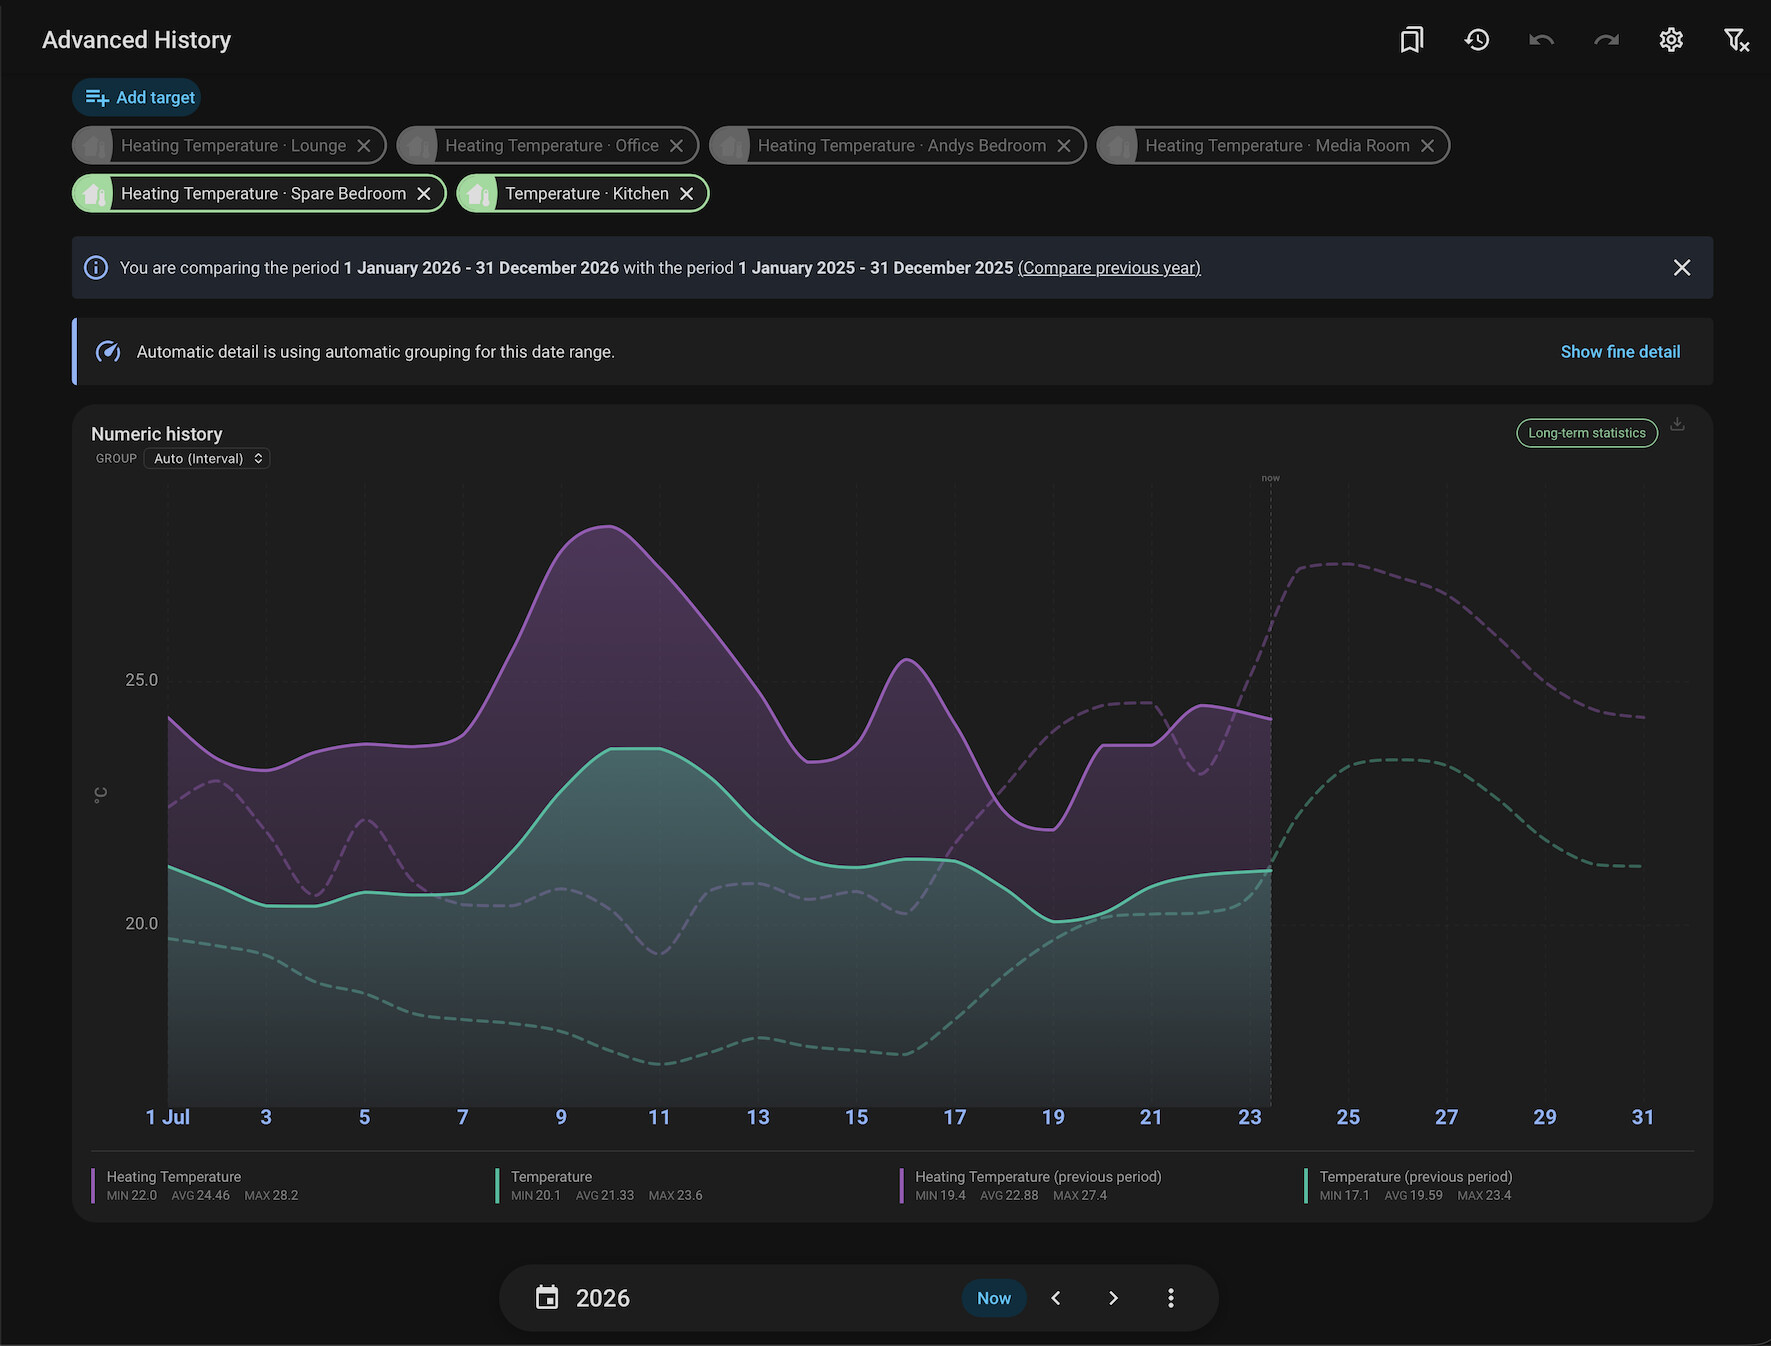
  • Previous-period and previous-year comparisons
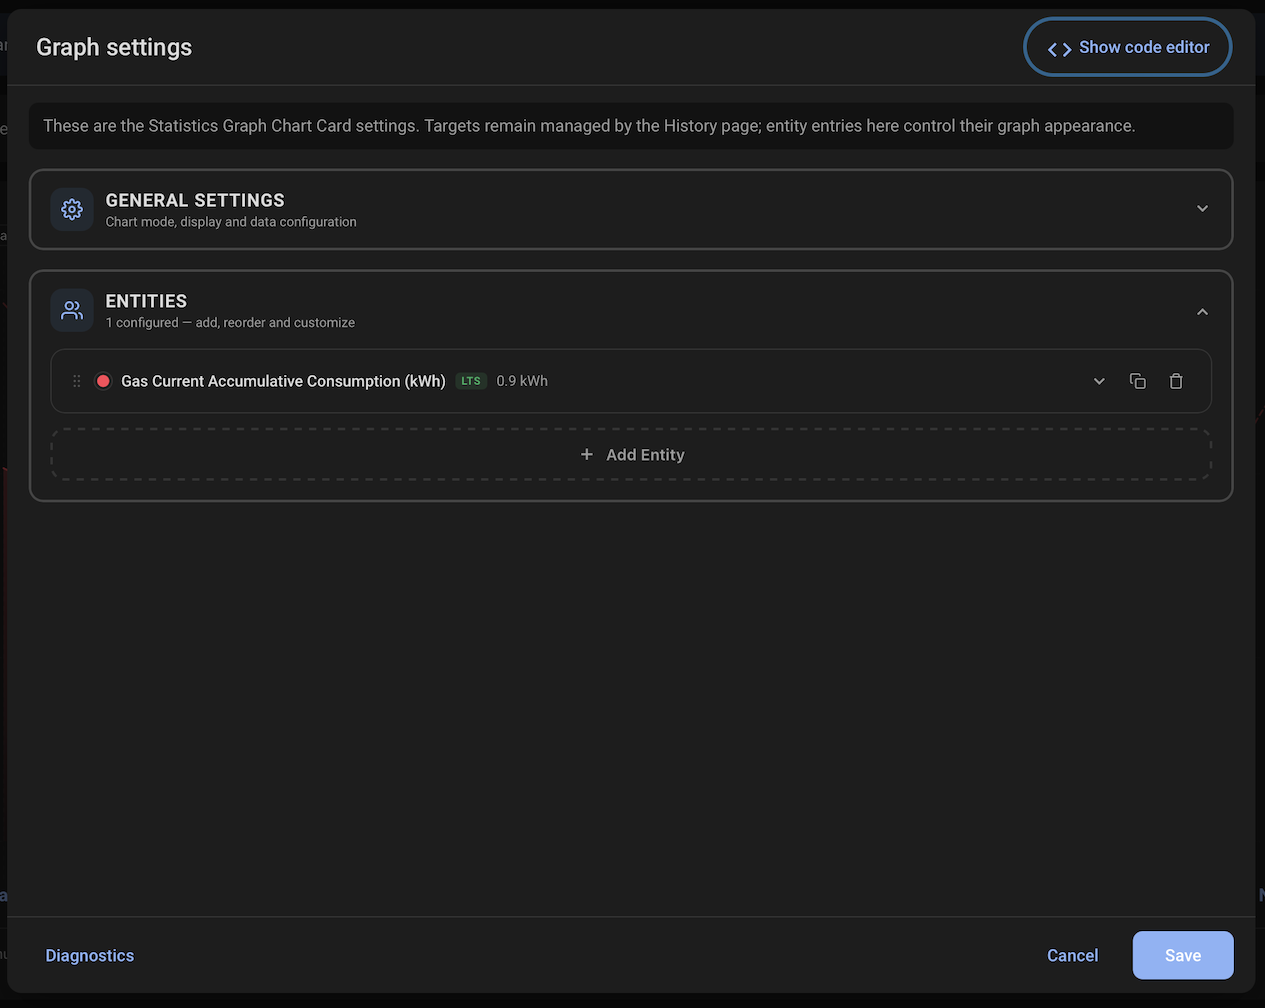
  • Full Statistics Graph Chart Card visual editor
  • Separate integration-wide Card Defaults
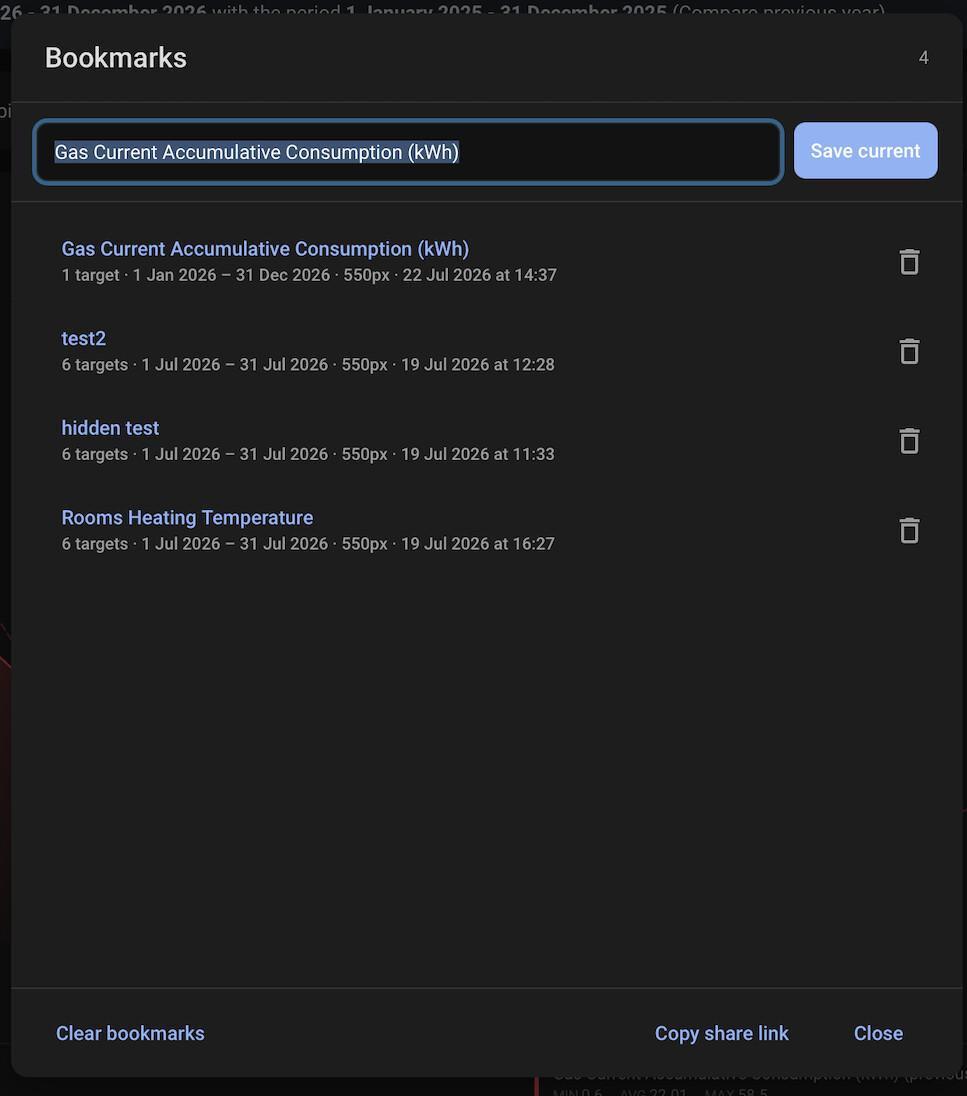
  • Named bookmarks containing targets, dates, and chart settings
  • User-specific bookmarks synchronized between devices
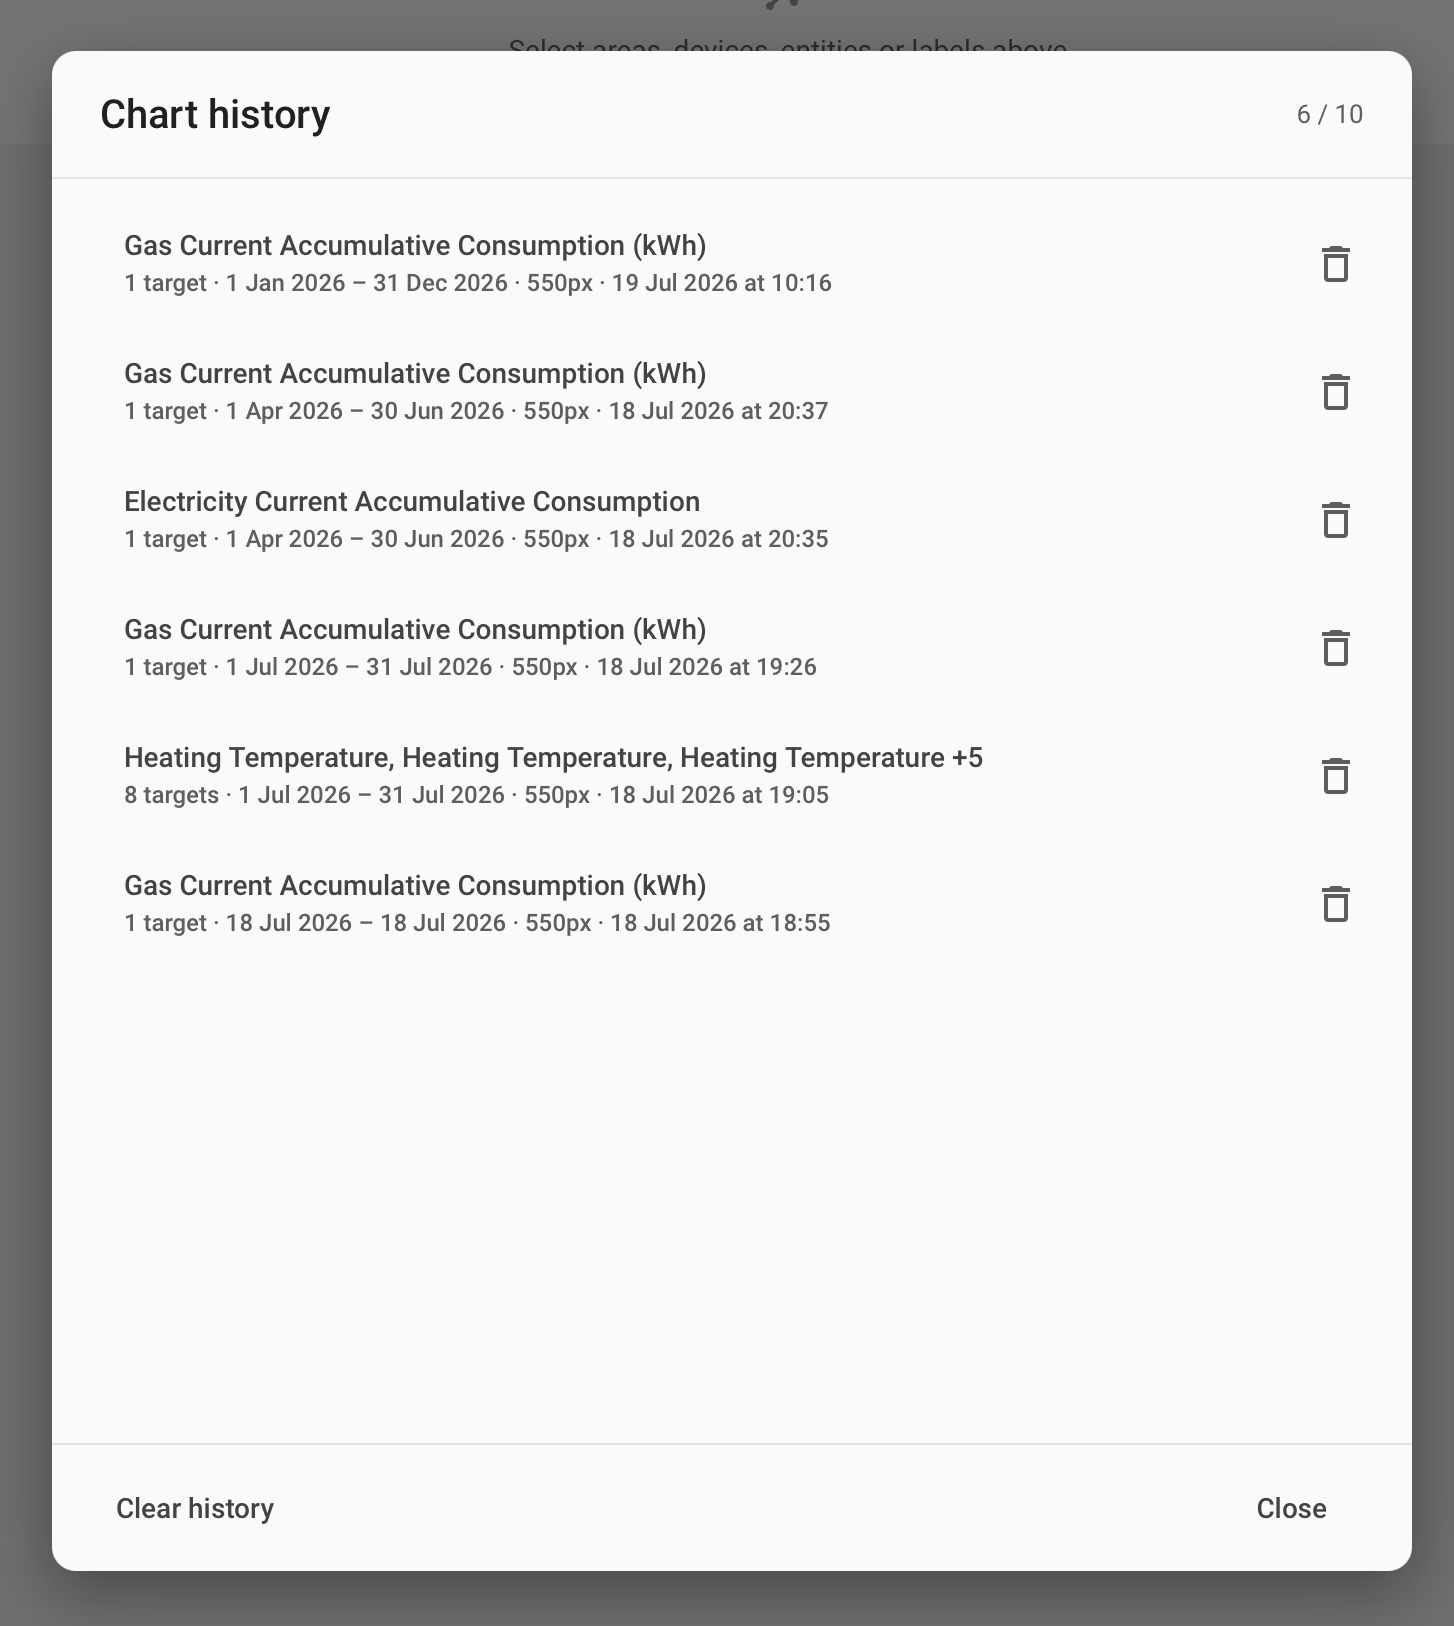
  • History of recently cleared or replaced charts
  • Undo and Redo for incremental chart changes
  • Saved date ranges and comparison modes
  • Loading feedback when restoring larger saved ranges
  • Optional redirection of an entity dialog’s Show more link
  • Mobile-friendly layout
  • Translations for several commonly used languages

When the final target is removed, the current chart is placed in History before the page resets to Today and turns comparison off.

Screenshots

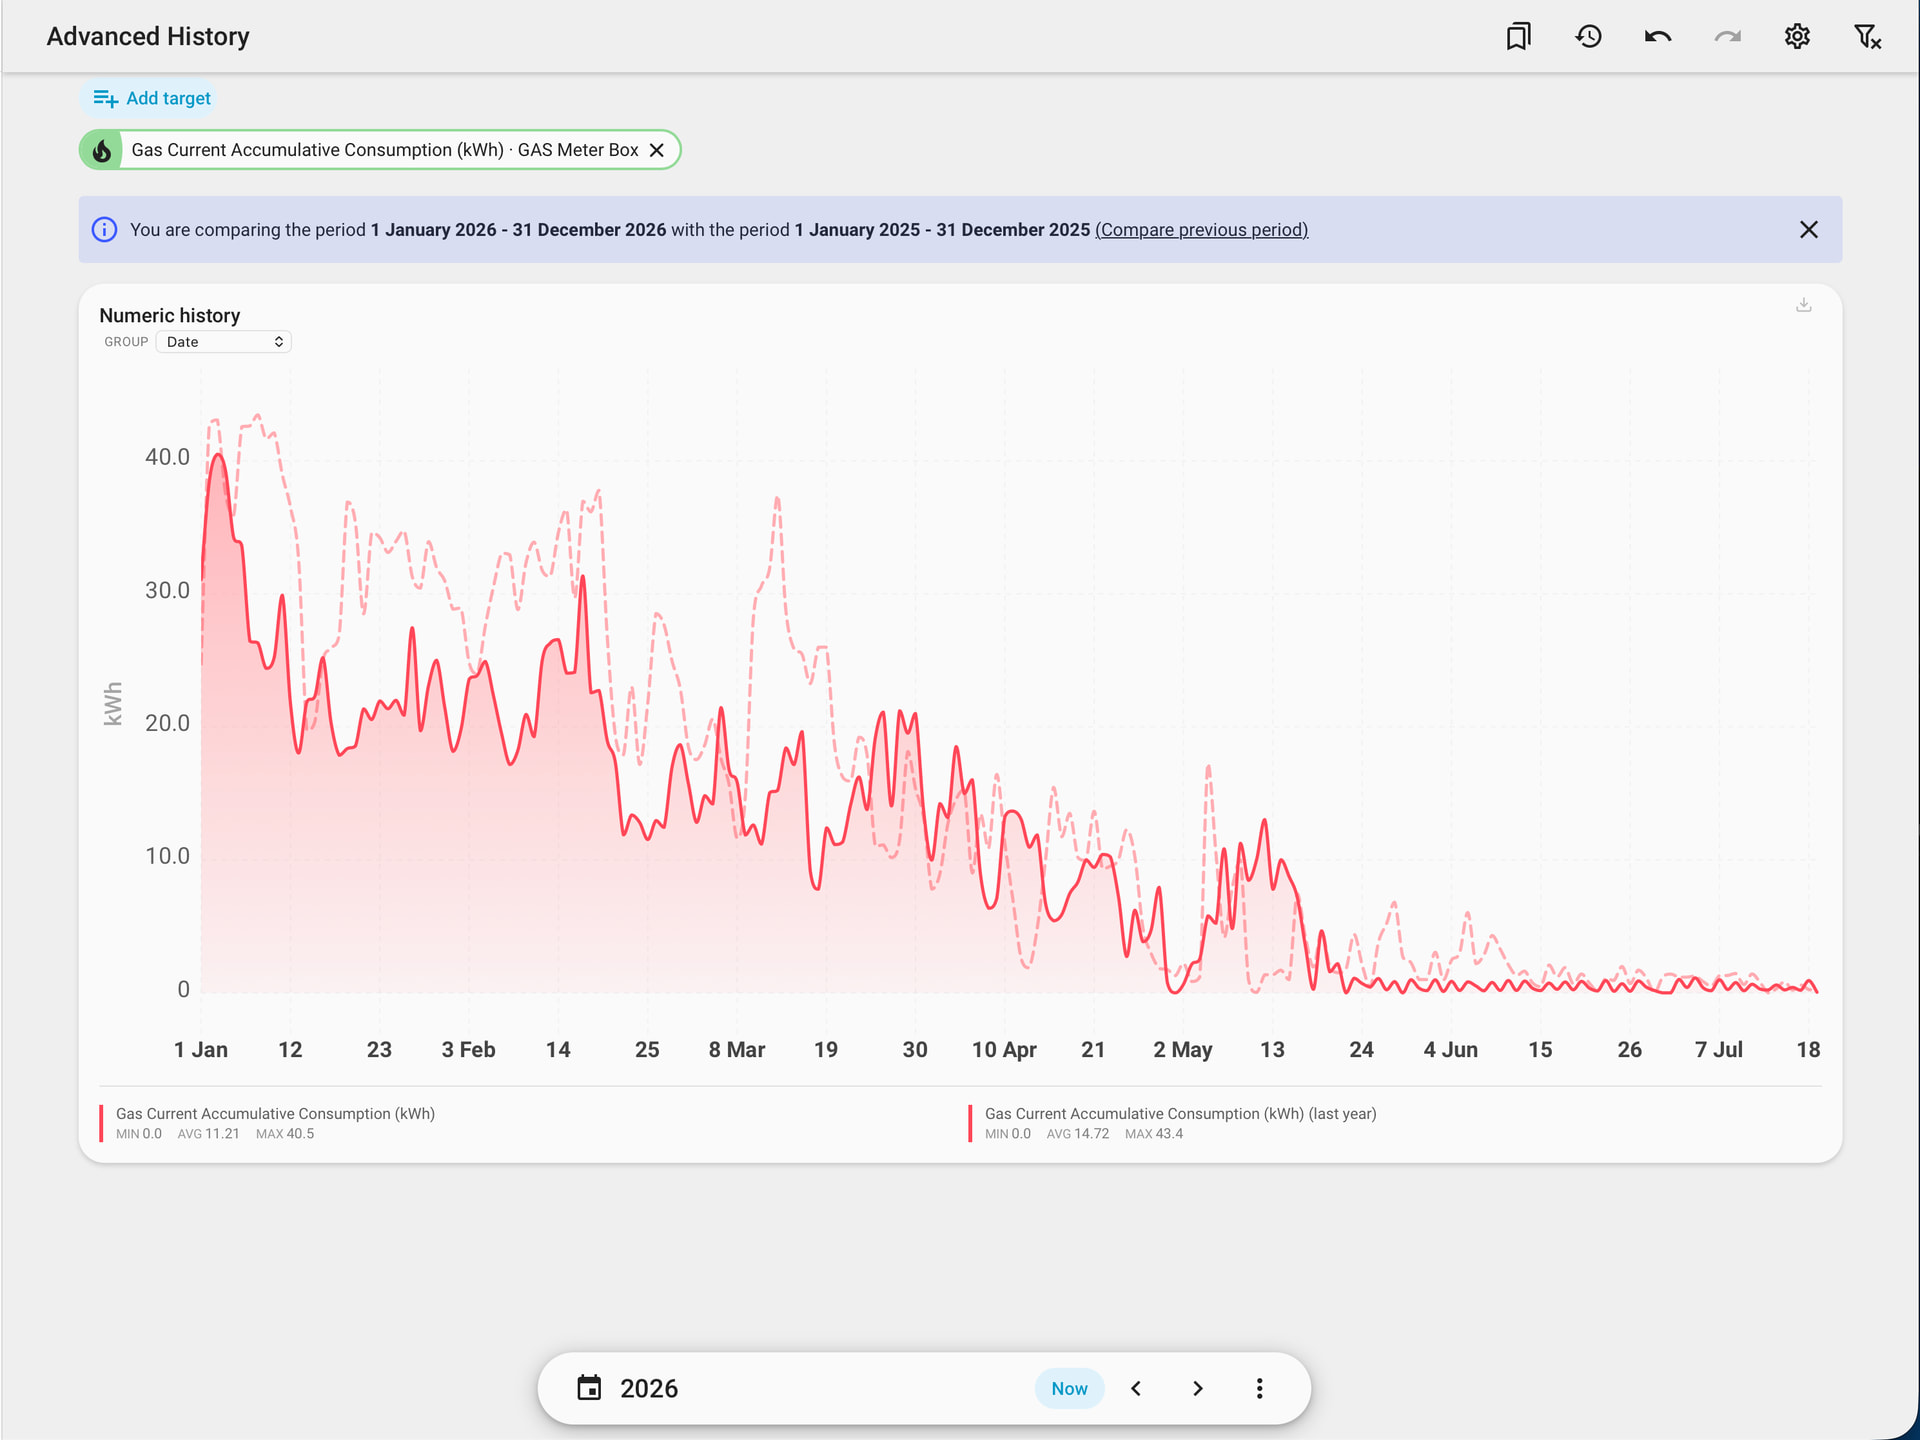
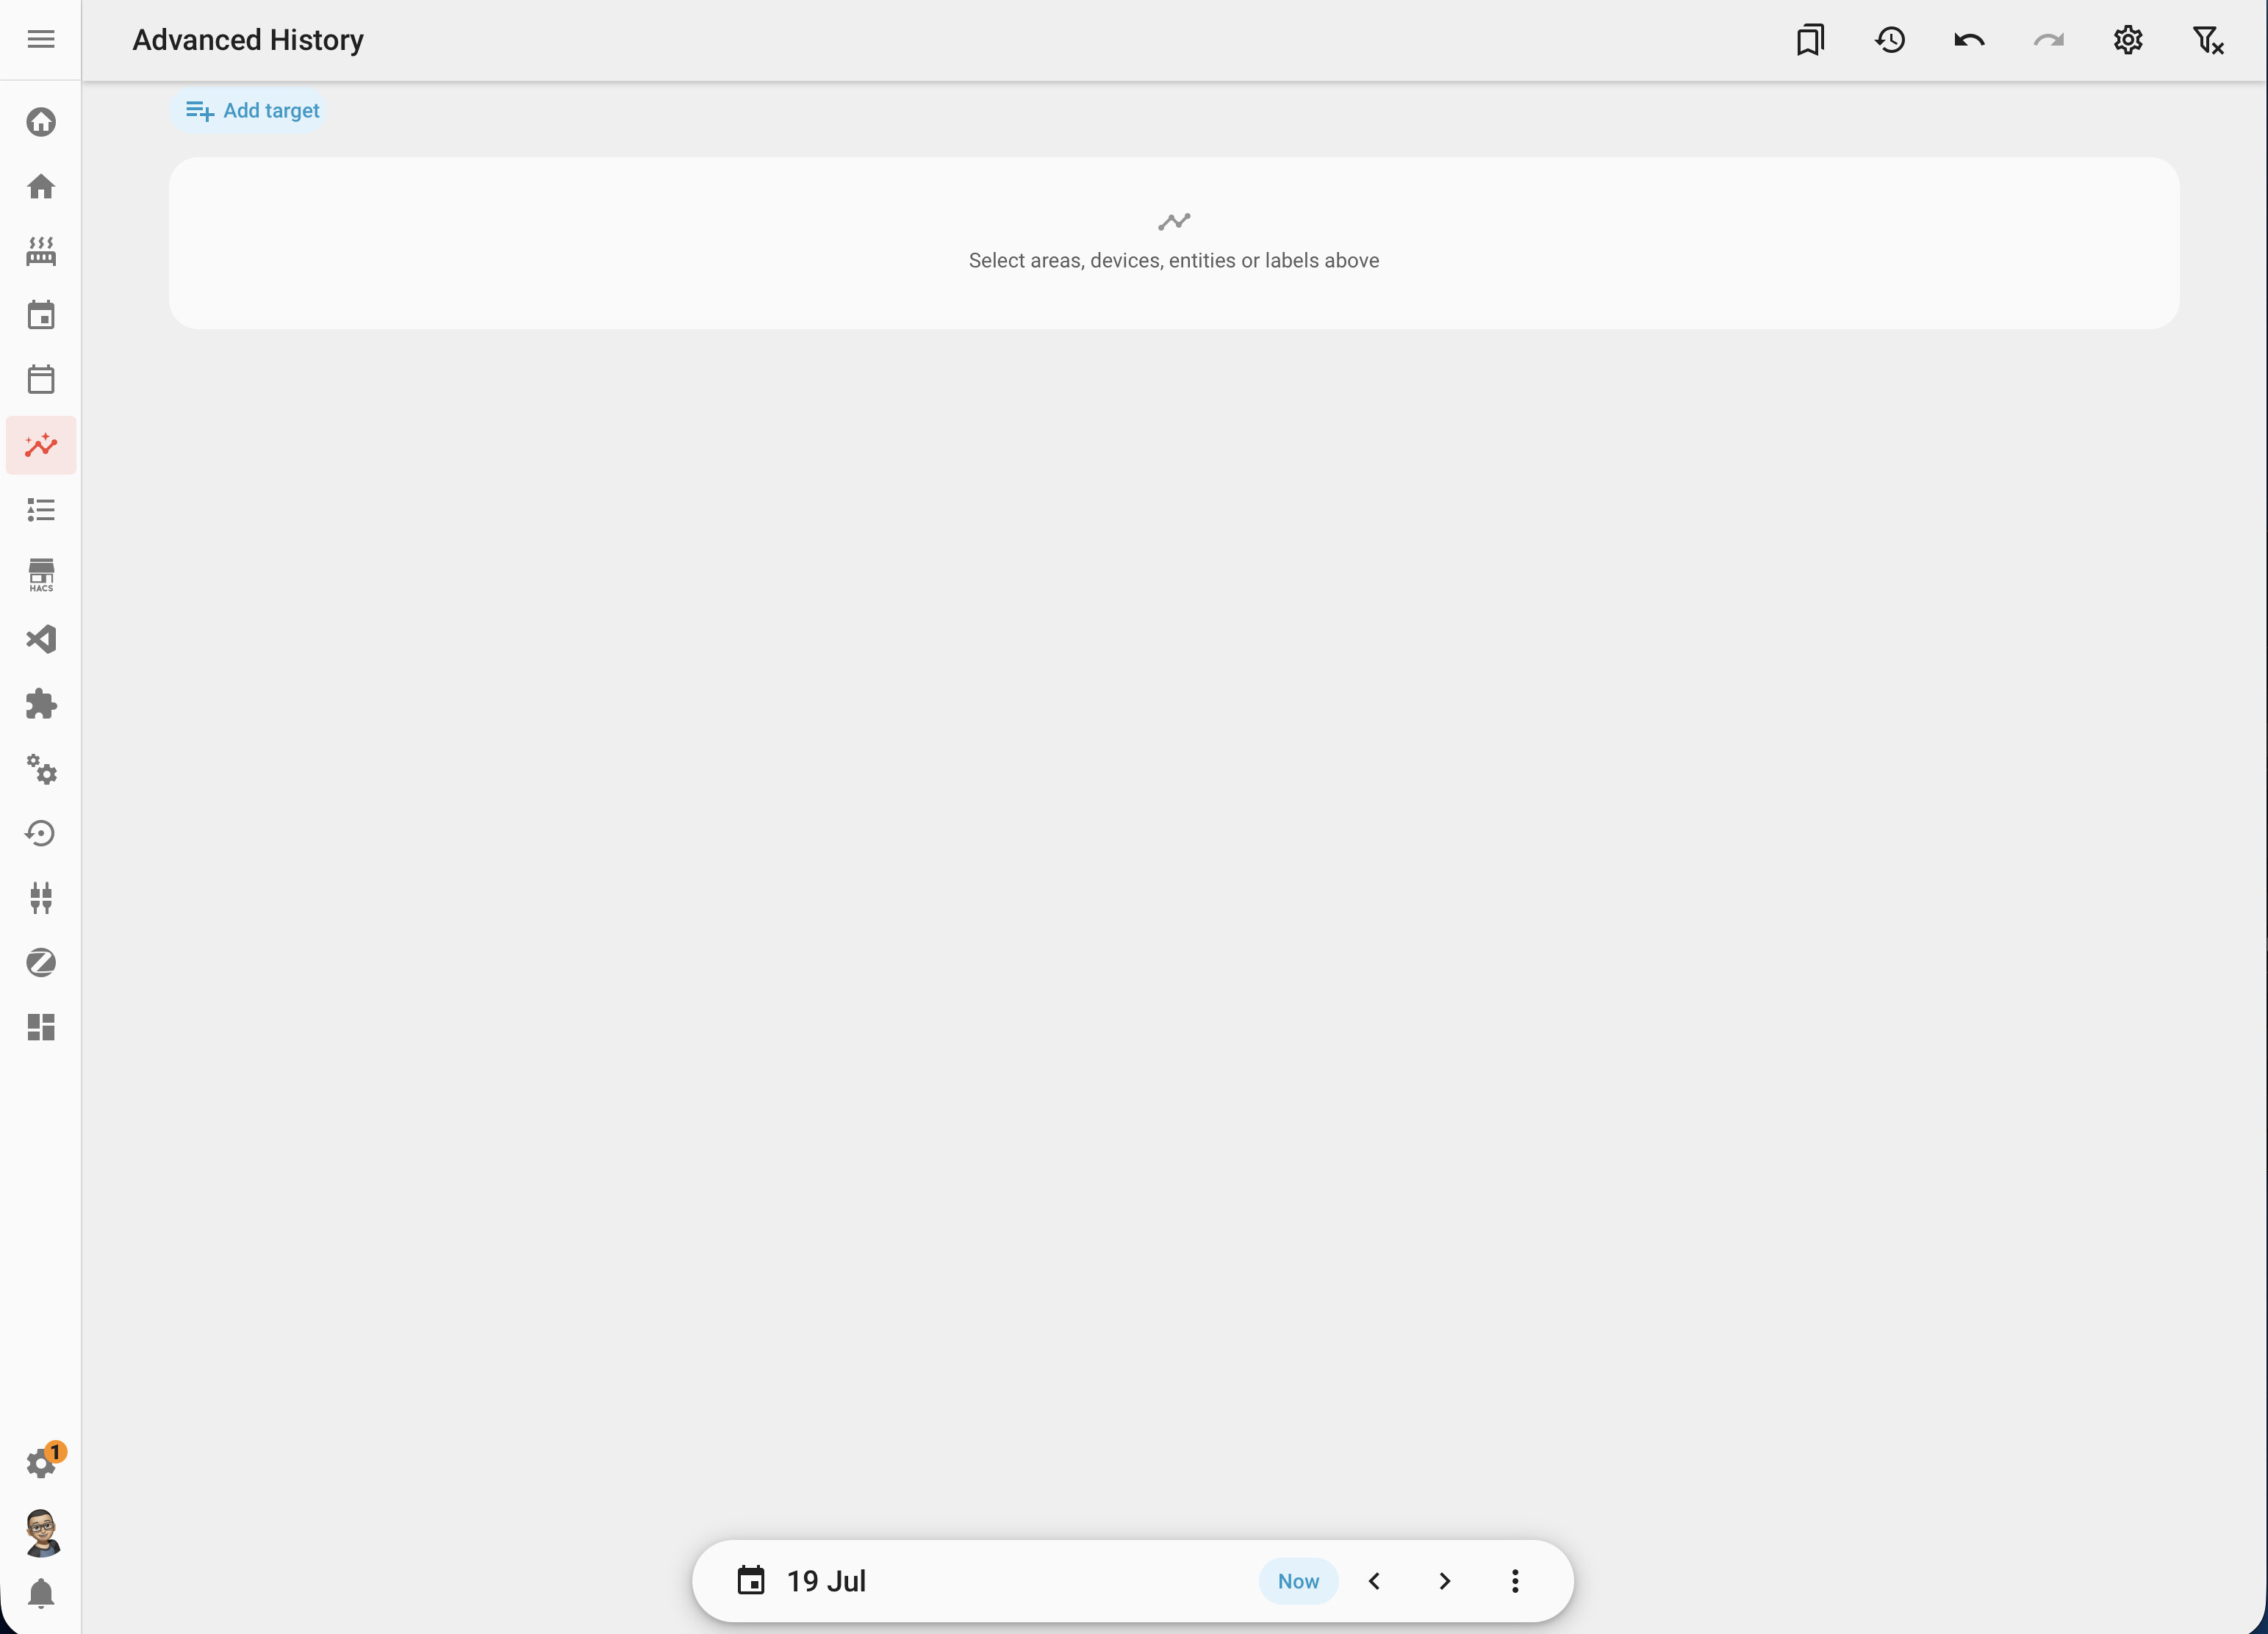
The main Advanced History page
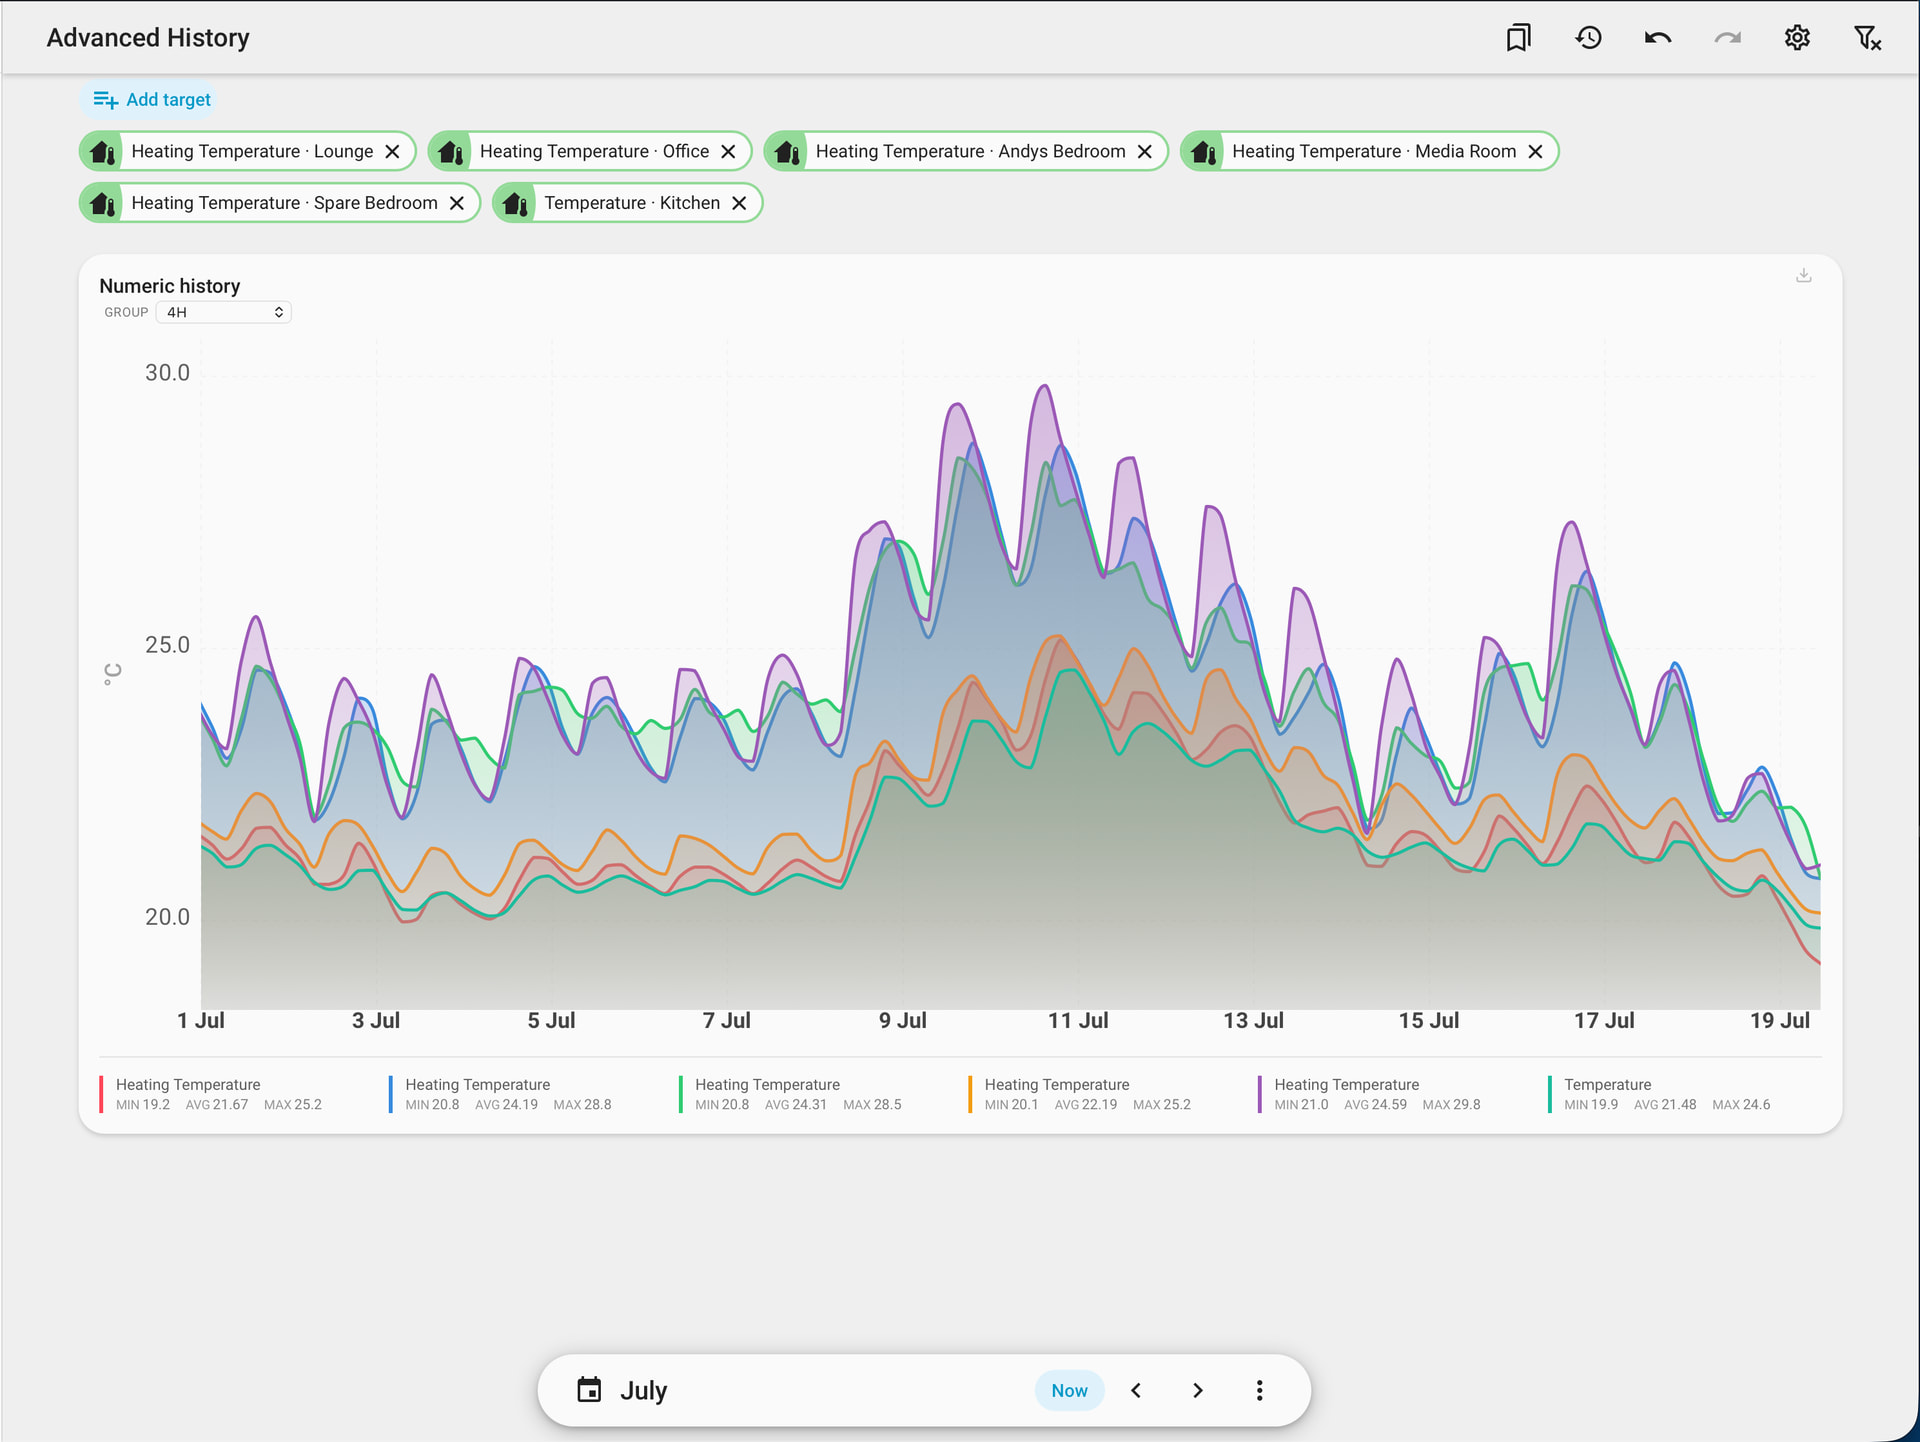
Multiple selected targets
Date comparison

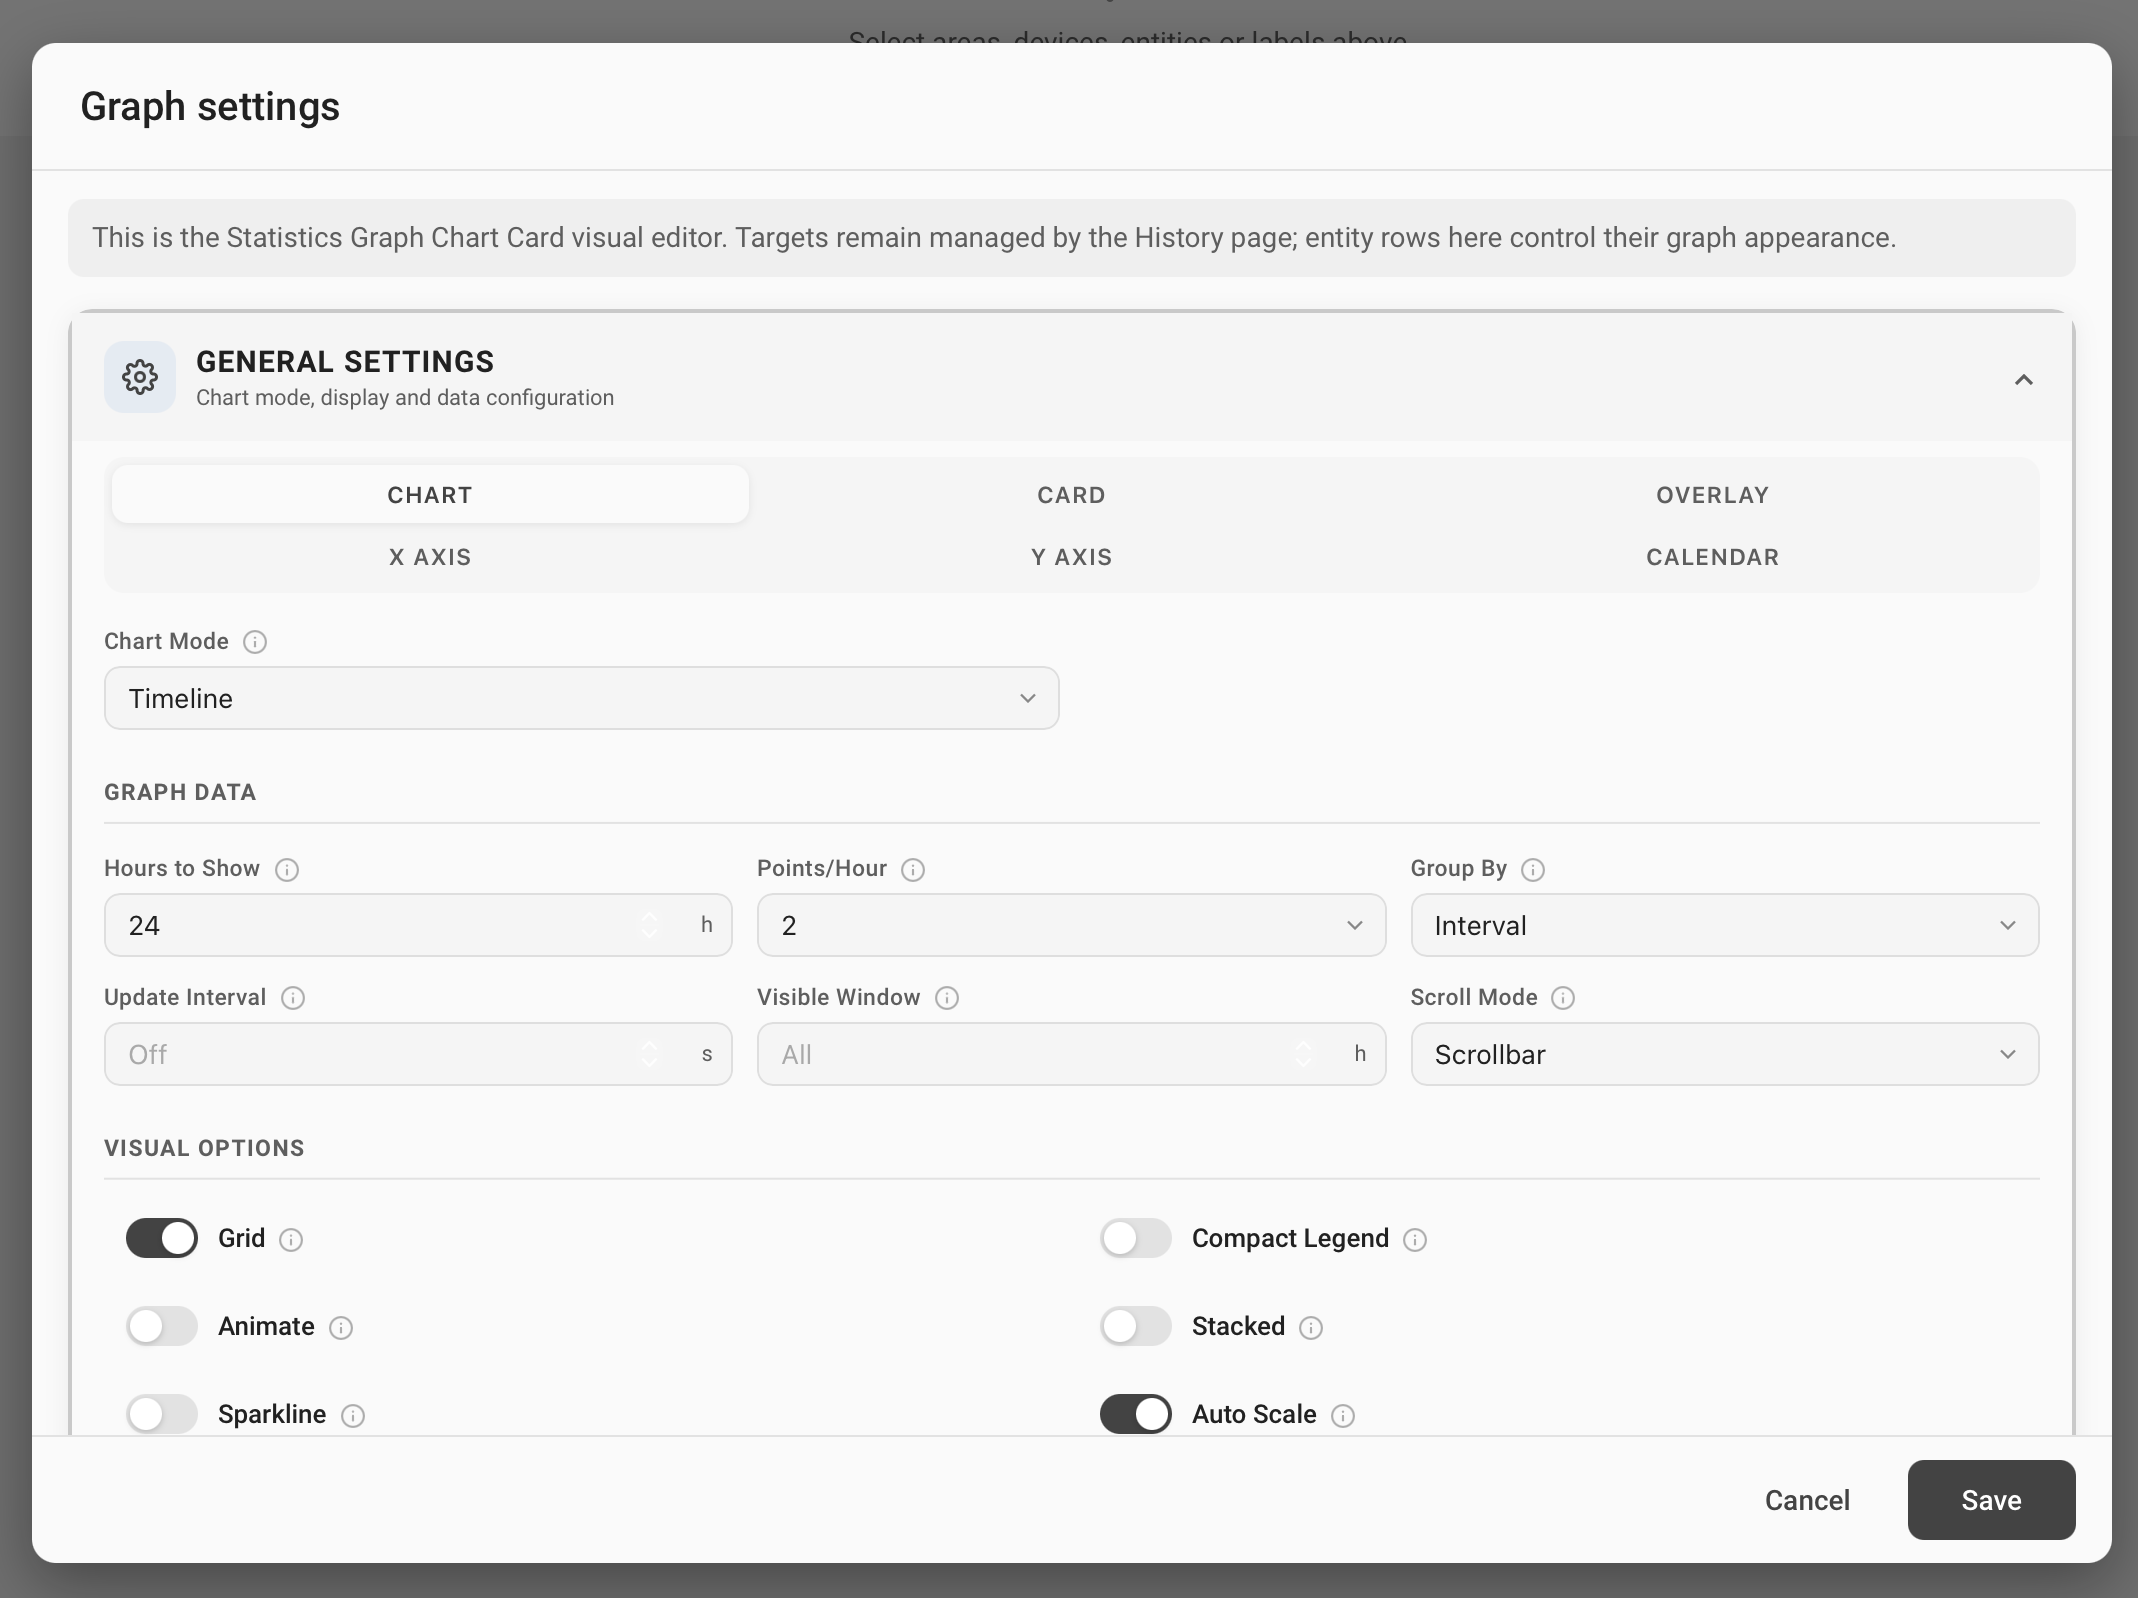
The graph visual editor
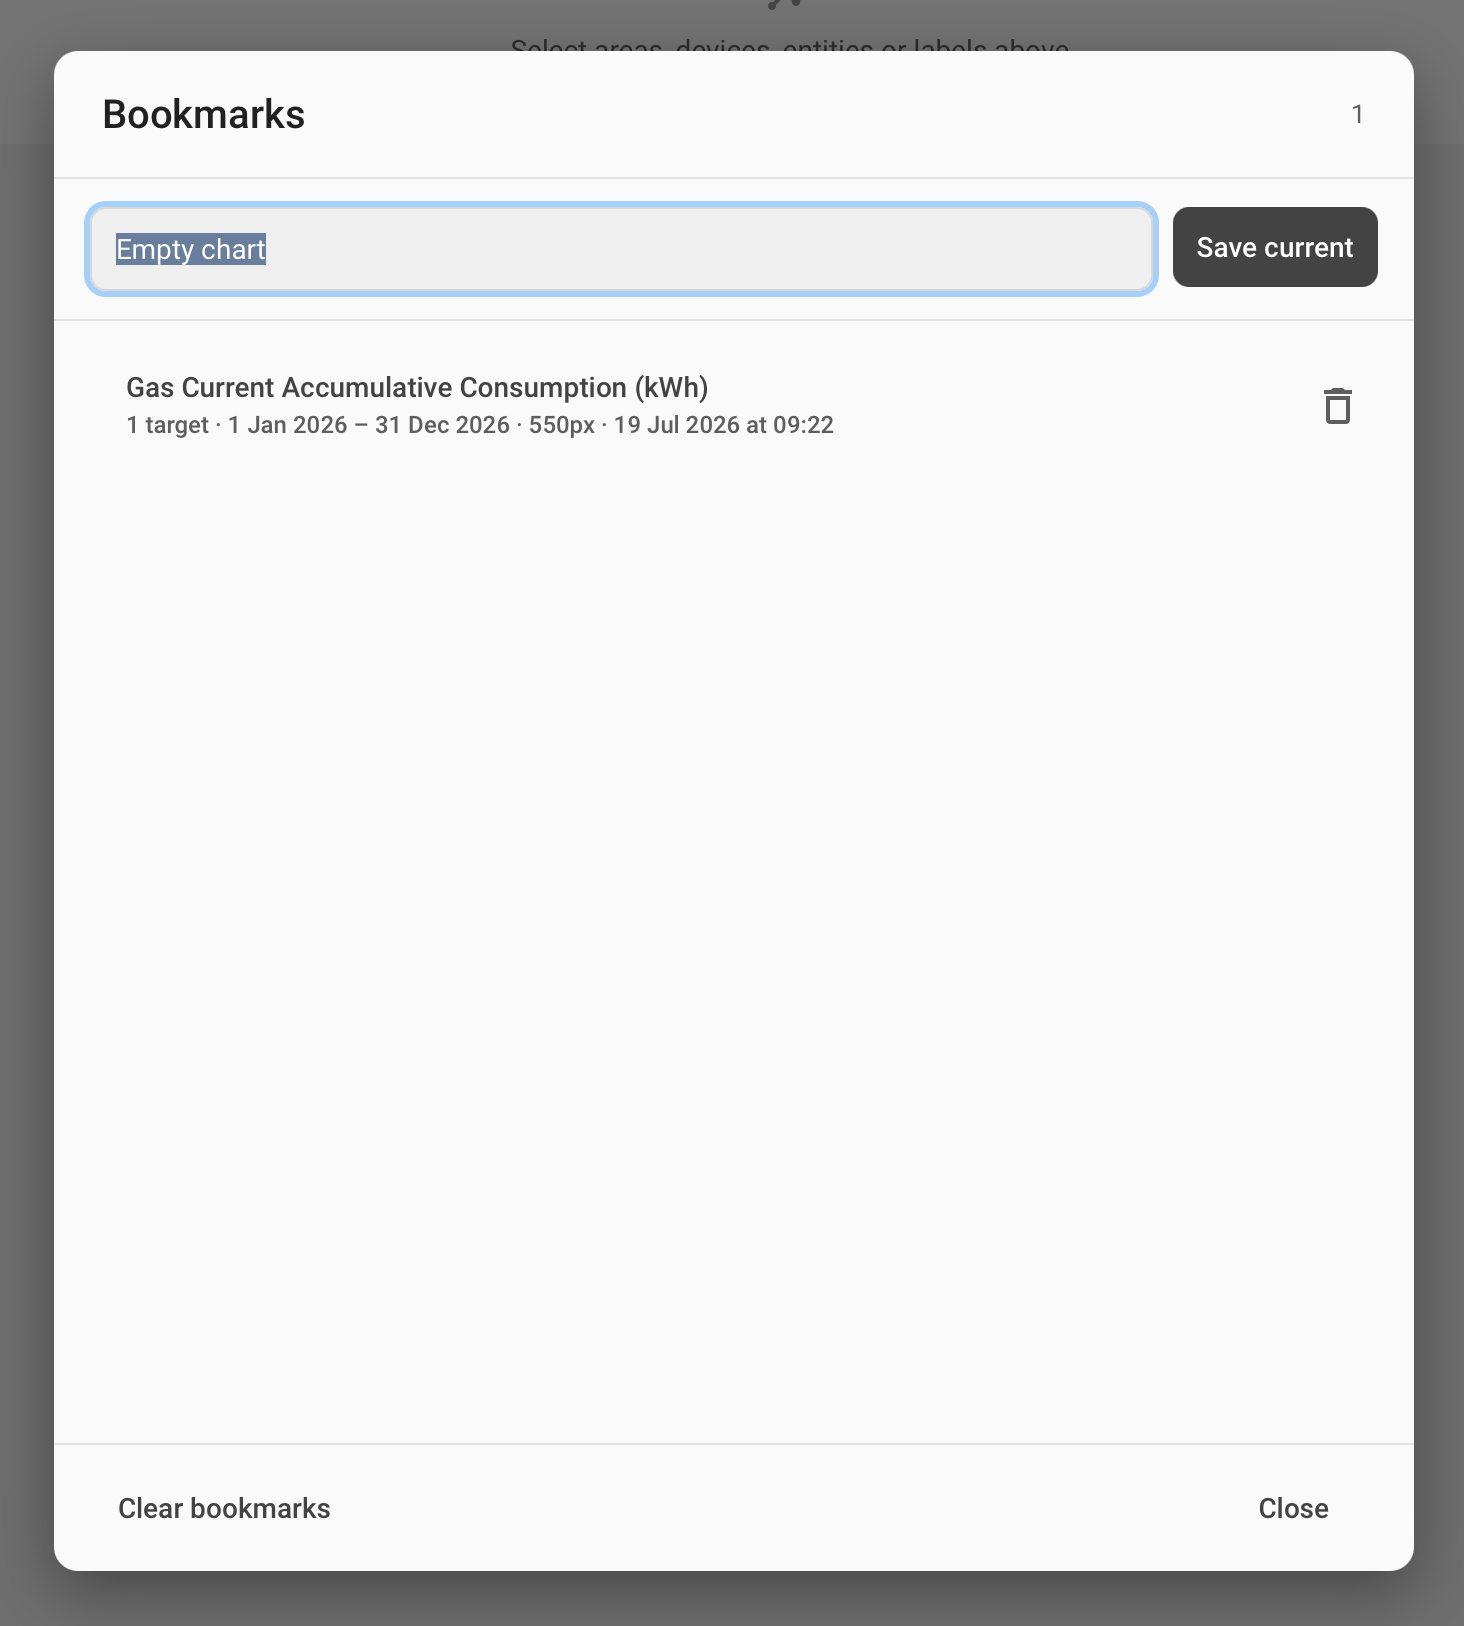
Bookmarks and History

Requirements

Advanced History requires:

Statistics Graph Chart Card is a separate dependency and is not bundled with Advanced History.

If it is missing, Advanced History displays an Install using HACS link and a Retry button.

Installation with HACS

Advanced History is currently installed as a custom HACS repository.

  1. Install Statistics Graph Chart Card through HACS.

  2. Open HACS → Integrations.

  3. Open the three-dot menu.

  4. Select Custom repositories.

  5. Add the following repository:

    https://github.com/andyblac/Advanced-History-Integration
    
  6. Select Integration as the category.

  7. Search for Advanced History and install it.

  8. Restart Home Assistant.

  9. Open Settings → Devices & services → Add integration.

  10. Search for Advanced History and complete the setup.

Project links

Current status

The current version is 0.9.0.

This is still a pre-1.0 development release, so configuration and behavior may change while I continue testing and improving it.

Feedback, testing, bug reports, and suggestions are very welcome. When reporting a problem, please include:

  • Home Assistant version
  • Advanced History version
  • Statistics Graph Chart Card version
  • Browser and device
  • Any relevant browser-console or Home Assistant log messages
  • Steps needed to reproduce the issue

Special thanks

A very special thanks to cataseven for creating Statistics Graph Chart Card, and for allowing and supporting its use in this project.

Advanced History is an independent community project. It is not an official Home Assistant, Open Home Foundation, HACS, or Statistics Graph Chart Card project.

3 Likes

Advanced History v0.6.1 Beta – More Info graph replacement

Hi everyone,

Advanced History v0.6.1 Beta is now available. This post covers the combined changes from v0.6.0 and v0.6.1.

New More Info graph replacement

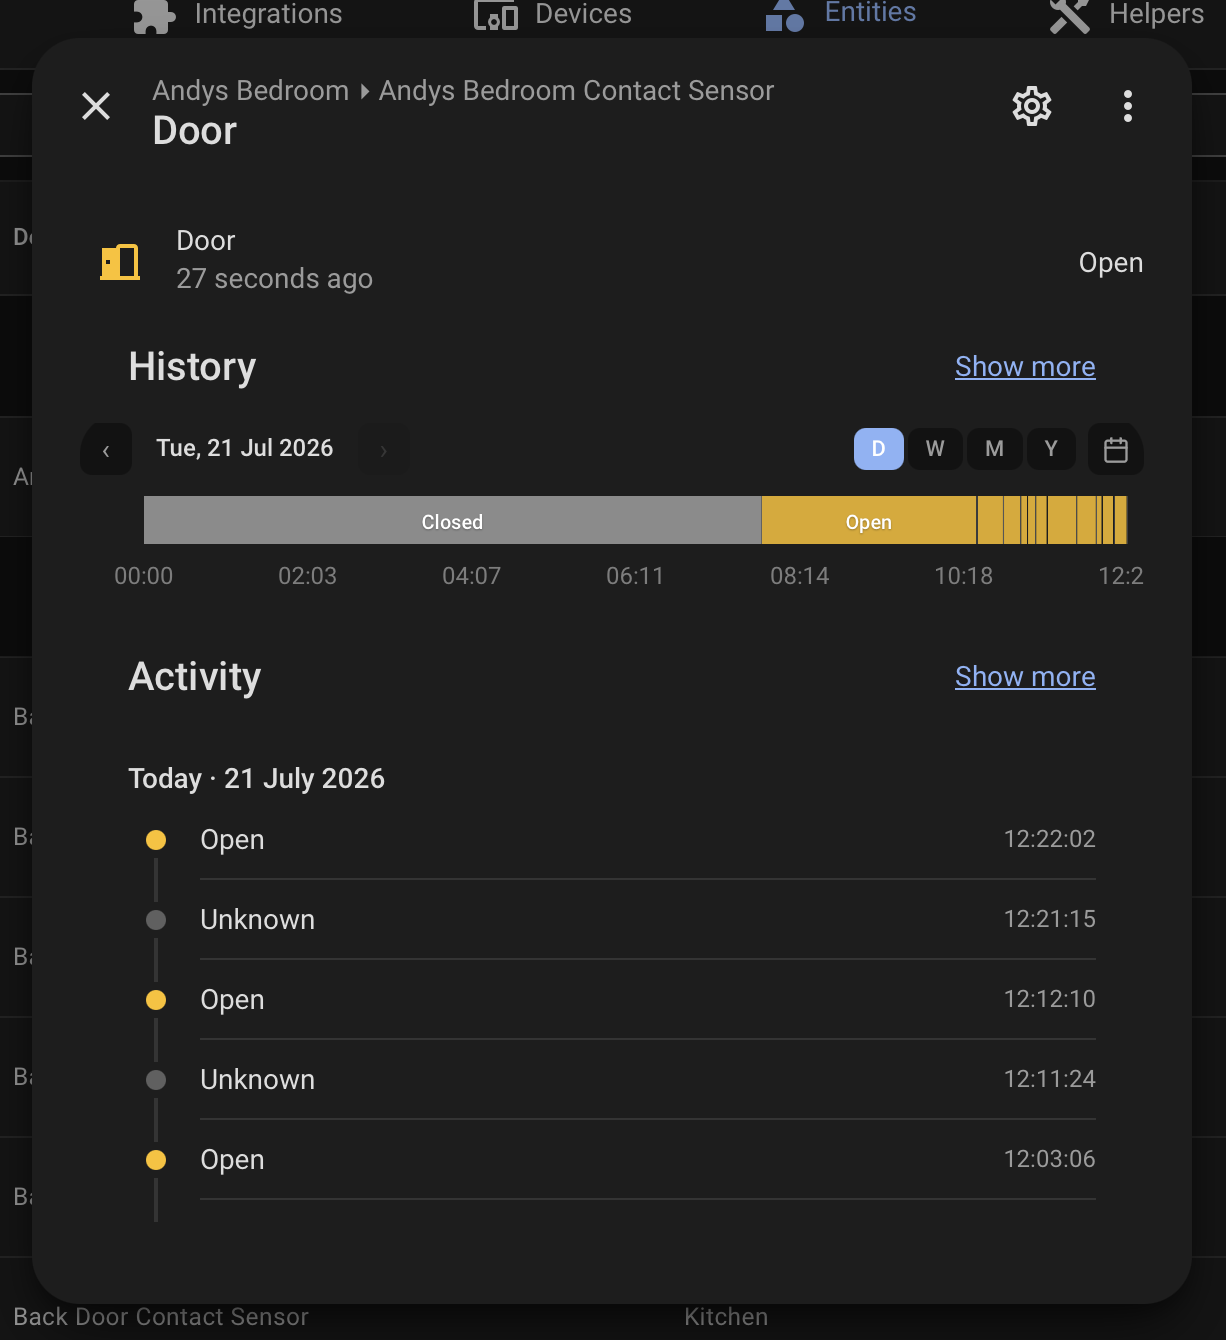
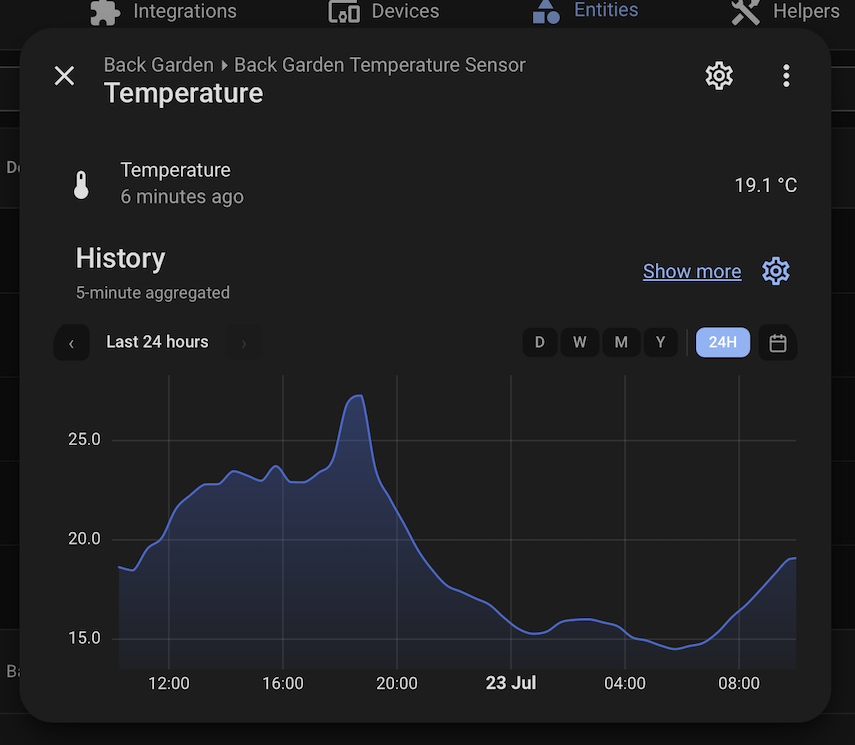
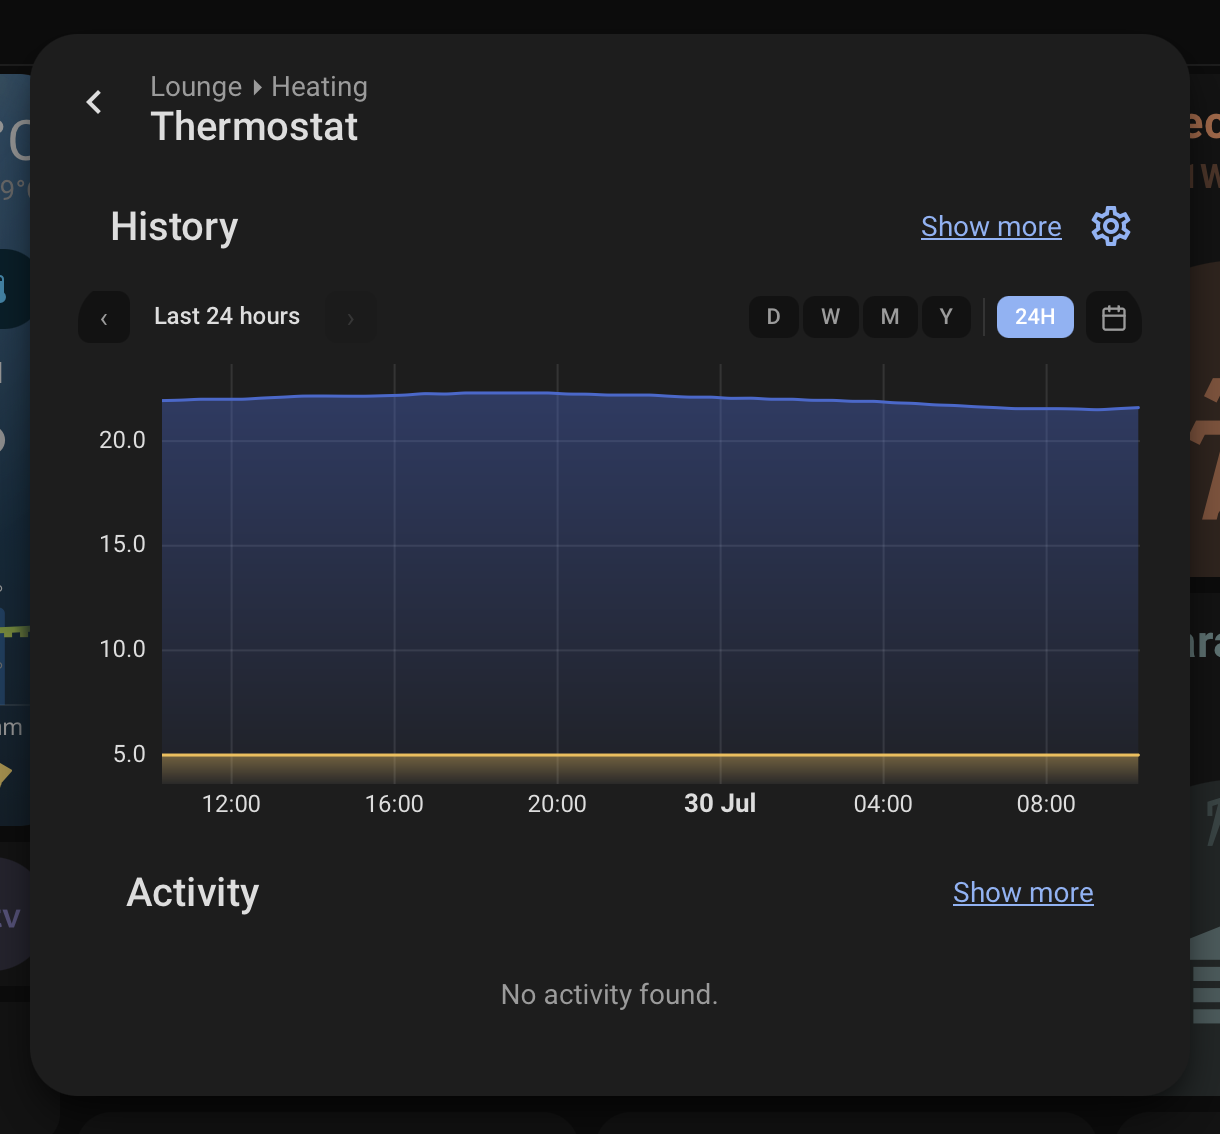
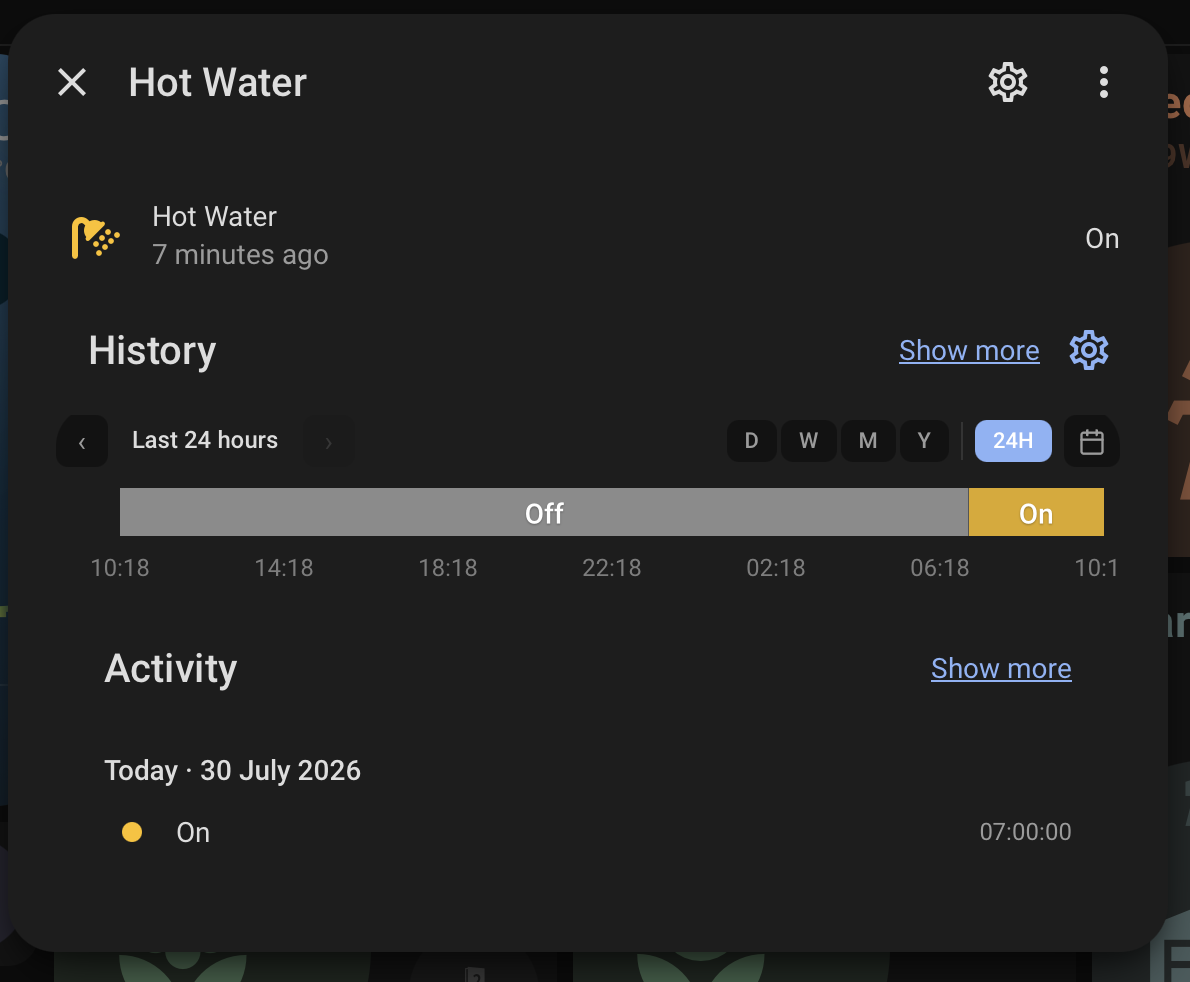
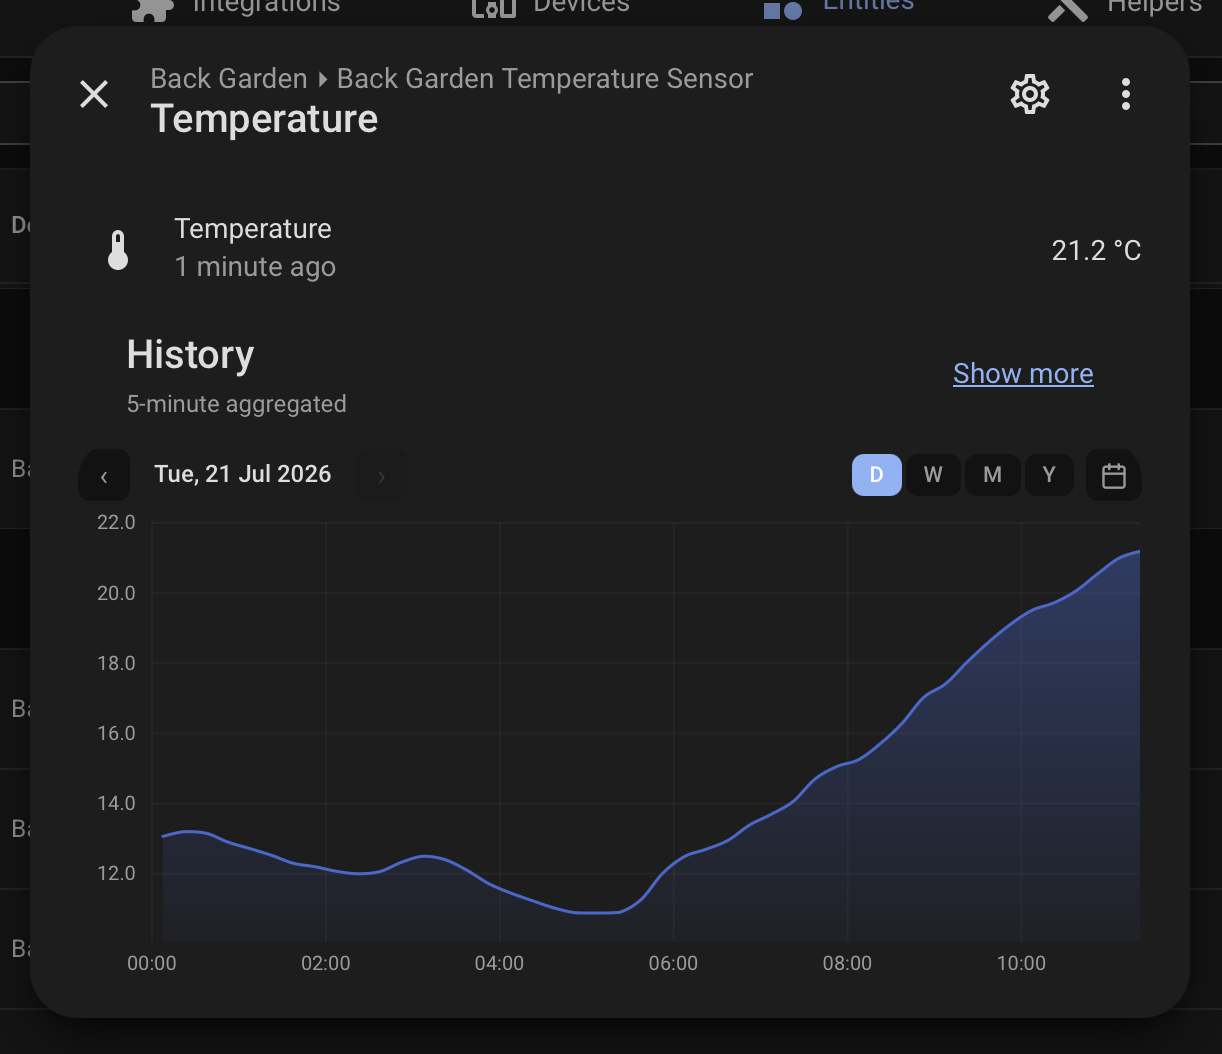
Advanced History can now replace Home Assistant’s native History graph inside entity More Info dialogs with Statistics Graph Chart Card.

The More Info graph has its own independent configuration, including:

  • Separate YAML card defaults
  • Statistics Graph Chart Card visual editor
  • Optional built-in chart calendar
  • Day view selected by default when the calendar is enabled
  • Independent enable/disable toggle
  • Automatic card resource detection
  • Home Assistant timezone handling

Native Home Assistant appearance

The replacement graph has been adjusted to more closely match Home Assistant’s native More Info graphs:

  • Native graph-series colors
  • Native binary sensor state colors
  • Native active, inactive, unknown and unavailable colors
  • Localized states such as Open and Closed
  • Native x-axis and y-axis font sizes
  • Native axis, date-marker and grid colors
  • Square state-timeline segments
  • Compact categorical timelines
  • Improved spacing and graph sizing
  • Redundant entity names hidden from single state timelines

Graph fill and tooltips remain enabled because they provide useful additional detail.

All defaults are visible in the More Info YAML configuration and can be changed or removed.

Reliability improvements in v0.6.1

  • Improved numeric and categorical entity detection
  • Numeric entities remain correctly classified when their current state is unknown or unavailable
  • Reduced clipping and excess whitespace
  • Improved the loading transition when replacing the native graph
  • Prevented disabled replacement mode from repeatedly redrawing or fighting the native Home Assistant graph
  • Existing More Info services automatically receive the new defaults without overwriting user-defined settings

Important for existing installations

New installations automatically create two Advanced History services:

  • Advanced History – the sidebar History panel
  • More-Info – the entity-dialog graph replacement

Existing installations from before v0.6.0 must add the More Info service manually:

  1. Open Settings → Devices & services.
  2. Open Advanced History.
  3. Select Add service.
  4. Configure More-Info.

The More Info replacement can then be enabled, disabled and configured independently.

Screenshots


Requirements

Advanced History requires Statistics Graph Chart Card.

Links

Special thanks to cataseven for creating Statistics Graph Chart Card and for allowing and supporting its use in Advanced History.

As this is still a beta release, feedback and bug reports are very welcome.

Advanced History 0.7.0 released

Hi everyone,

Advanced History 0.7.0 is now available. This is a substantial update containing everything added since 0.6.1, including shareable charts, privacy-safe diagnostics, data-source detection, large-range detail modes, per-entity More Info graph settings, and numerous bookmark and date synchronization fixes.

Advanced History provides a Home Assistant-style History panel with the more powerful graphing capabilities of Statistics Graph Chart Card.

Advanced History remains a pre-1.0 project. Please review the upgrade notes before updating.

Important upgrade notes

Statistics Graph Chart Card v3.30 or newer is now required. Update the card through HACS before installing Advanced History 0.7.0.

After updating:

  1. Restart Home Assistant.
  2. Refresh the browser or fully reload the Home Assistant app.

Existing installations must remove and re-add the More-Info service to receive the new date-picker modes:

  • Day
  • Week
  • Month
  • Year
  • Last 24 hours

If you customized the More Info Card Defaults YAML, copy it before removing the service so you can restore it afterwards.

Existing bookmarks and Advanced History settings are retained.

Shareable charts

Charts can now be shared directly from the Bookmarks dialog.

Shared links contain the targets, chart configuration, date range, comparison, and visibility state required to recreate the chart.

They can be opened on another device or by another Home Assistant user who has access to the referenced entities.

Privacy-safe diagnostics

A new diagnostics report is available from Graph Settings. This should make it much easier to provide useful information when reporting a problem.

Reports include:

  • Advanced History, Home Assistant, and Statistics Graph Chart Card versions
  • Browser, language, viewport, and time-zone information
  • Selected period and comparison
  • Sanitized chart configuration
  • Detected data sources
  • Entity metadata relevant to chart rendering

Entity IDs are replaced with anonymous aliases. Friendly names, registry IDs, history values, bookmarks, and other private entity details are excluded.

The report can be previewed before copying.

Data-source badges

Charts now show which Home Assistant data source was actually used:

  • Recorder history
  • Long-term statistics
  • Mixed sources
  • Determining source

Detection follows the requests made by the rendered chart and refreshes when the date range or comparison changes.

The detected source is retained when navigating away from Advanced History and returning.

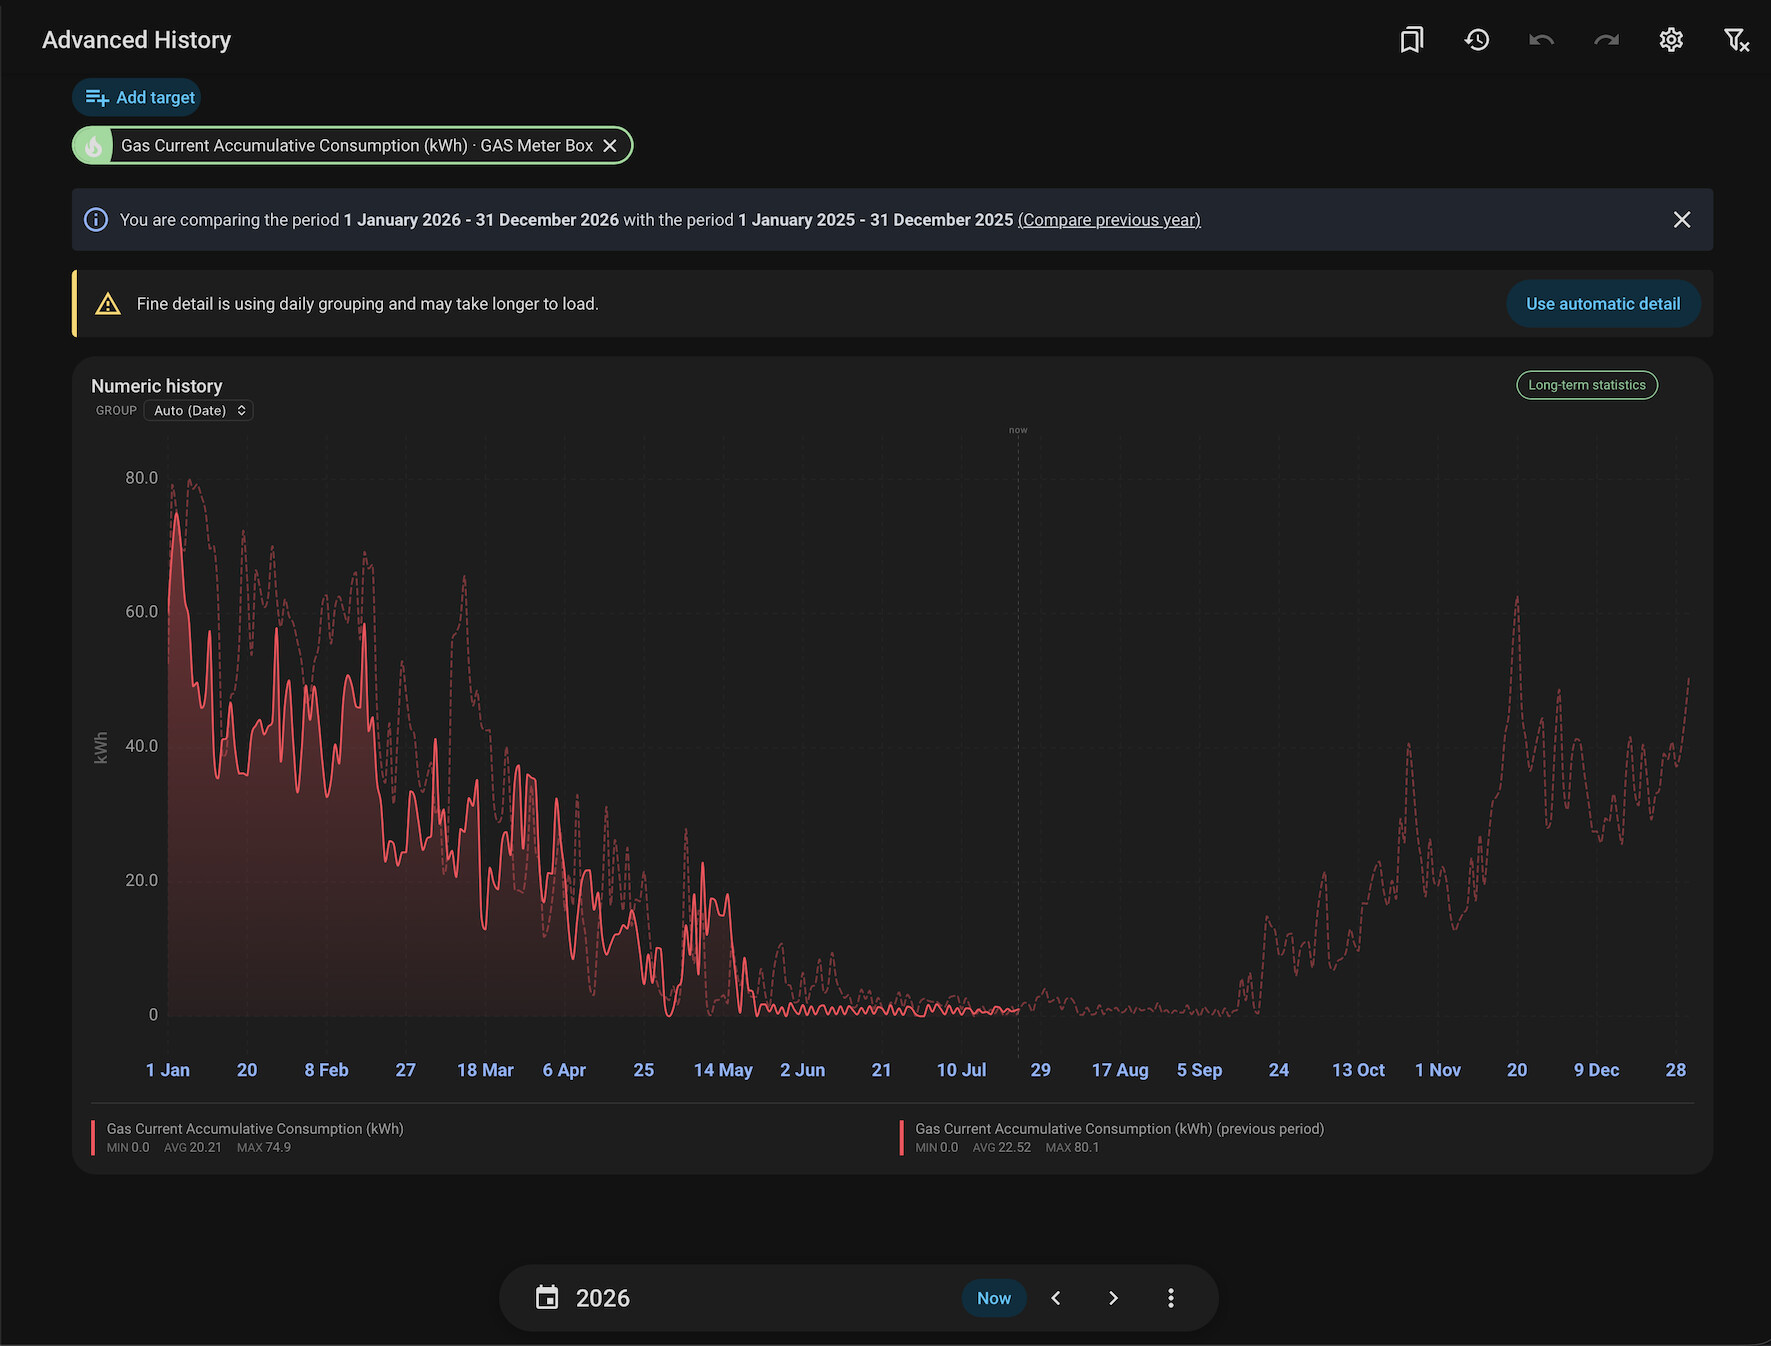
Automatic and fine detail modes

Large date ranges now have adaptive detail handling:

  • Automatic detail uses the card’s automatic grouping for faster loading and rendering.
  • Fine detail uses denser grouping when more detail is required.
  • A banner explains the active mode and allows switching between them.
  • Fine detail remains selected when changing date ranges until explicitly changed or the chart is cleared.
  • The Group By picker is displayed where appropriate.

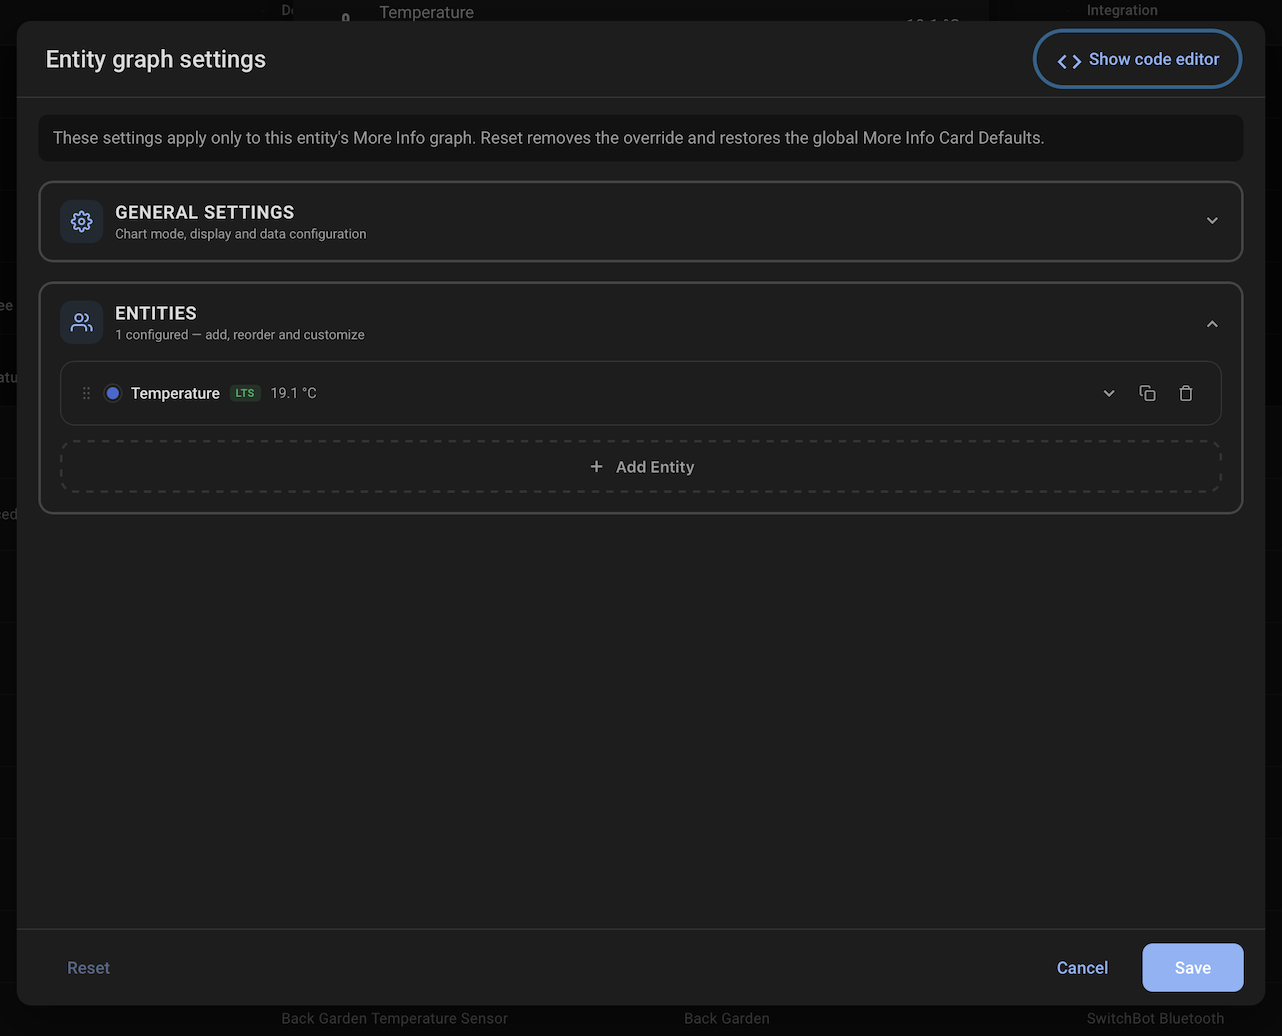
Per-entity More Info graph settings

Administrators can now configure the More Info graph separately for individual entities.

The More Info dialog includes an admin-only settings cog for supported graphs. It uses the same reusable visual and YAML editor as the main Advanced History panel.

Entity-specific settings are stored by Home Assistant and therefore work across devices.

A confirmation dialog is provided when resetting an entity to the global More Info Card Defaults.

New More-Info services also:

  • open using a rolling Last 24 hours period;
  • provide Day, Week, Month, Year, and Last 24 hours modes;
  • respect the entity’s configured display precision;
  • use metadata-aware chart defaults;
  • retain tooltips and filled-area presentation;
  • better match Home Assistant’s native colors, typography, and spacing.

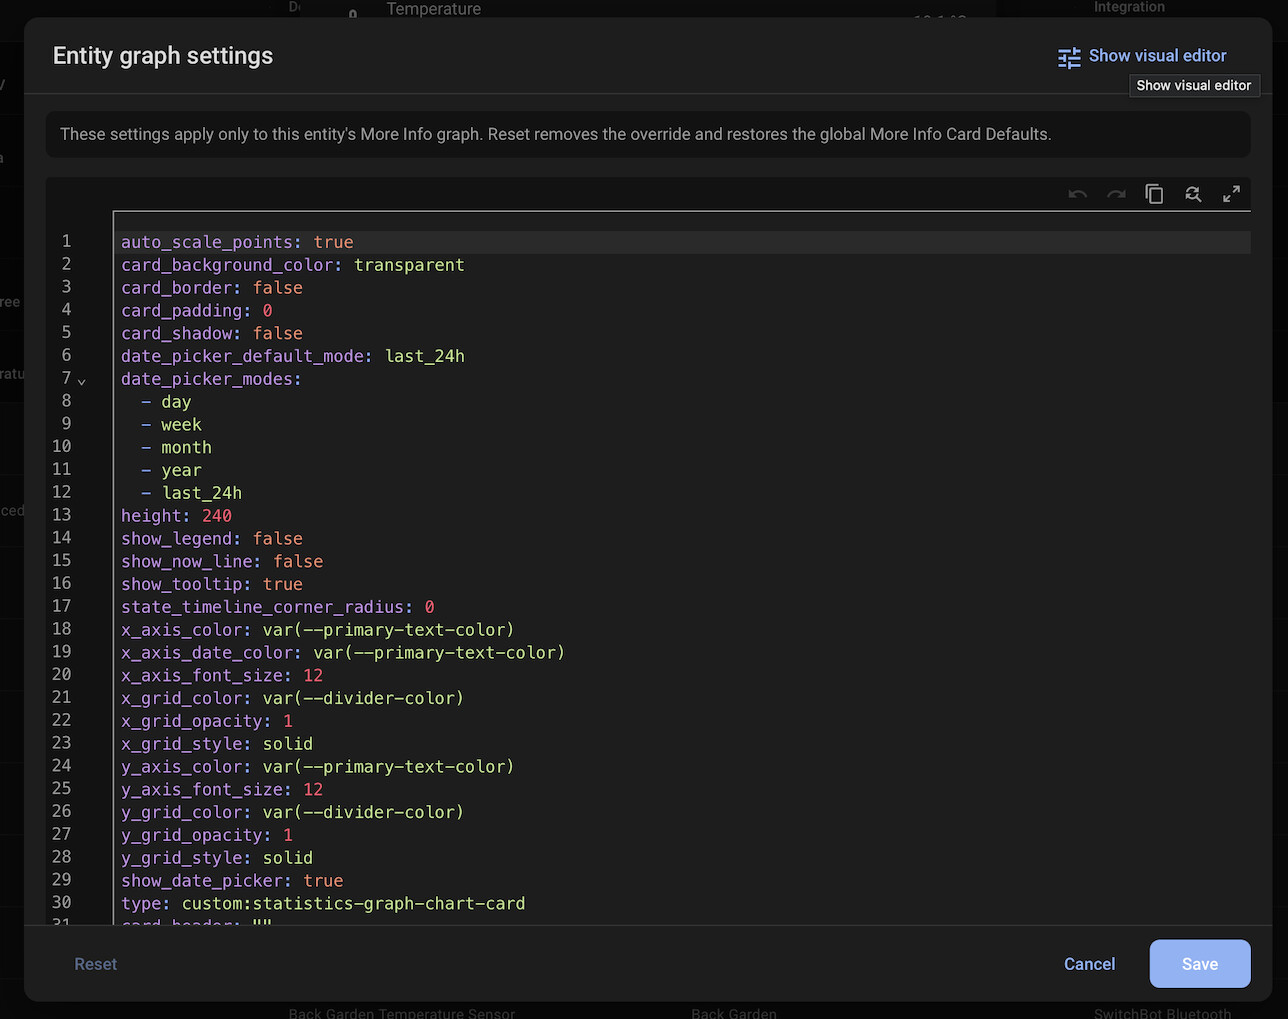
Visual and YAML chart editing

The current chart editor now supports switching between the visual editor and a YAML code editor.

Both modes use the same configuration and editor dialog. YAML is validated before being applied.

This update also fixes comparison series disappearing after closing or saving the editor.

Native entity visibility

Clicking a selected target now uses Statistics Graph Chart Card’s native entity visibility option:

enabled: false

The entity remains selected and keeps its position, color, and configuration while hidden.

This means:

  • hidden targets remain visible in the target list;
  • entity ordering is preserved;
  • automatically assigned colors remain stable;
  • visibility is retained in bookmarks, history, and shared links;
  • hiding an entity does not become an unintended permanent editor override.

Bookmark and undo improvements

Bookmarks now track ownership more reliably:

  • The Update action appears only for the bookmark that was loaded and then edited.
  • Loading another bookmark resets bookmark ownership correctly.
  • Clearing the final target detaches the chart from its bookmark.
  • Internal date synchronization no longer marks bookmarks as edited.
  • Existing bookmarks can still be loaded and saved as new bookmarks.

Undo and redo now behave as separate chart sessions:

  • Undo and redo are cleared when all targets are removed.
  • Loading a bookmark starts with a clean undo/redo history.
  • Saved-period restoration no longer creates stale undo entries.
  • Undo state from a previous chart is no longer shown after loading another bookmark.

Energy date synchronization

Date-range restoration has been substantially improved:

  • Saved date ranges and comparisons restore more reliably.
  • The chart remains behind the loading banner until Home Assistant confirms the restored Energy period.
  • Cached “today” data can no longer override a restored month or year.
  • The native picker, comparison banner, and graph use the same confirmed period.
  • Comparisons are retained after editing chart settings.
  • Bookmark loading and returning to the panel no longer leave the date picker out of sync.

Other improvements

  • Total and total-increasing sensors automatically use last-value aggregation where appropriate.
  • Explicitly configured aggregation still takes precedence.
  • More Info graph sizing and whitespace have been improved.
  • State-timeline presentation better matches Home Assistant’s native colors.
  • Duplicate-name area handling has been improved.
  • The More Info frontend module was renamed to reflect its expanded role.
  • Prerelease version badge handling was fixed.
  • Documentation and setup guidance were expanded.

Required dependency

Advanced History 0.7.0 requires Statistics Graph Chart Card v3.30 or newer.

The card remains a separate dependency and is not bundled with Advanced History.

Special thanks to cataseven for continuing to improve Statistics Graph Chart Card and for supporting its use in Advanced History.

Feedback and bug reports are welcome on the GitHub issue tracker.

Advanced History v0.9.0: entity attributes, improved State Timelines and better More Info graphs

Hi everyone,

Advanced History v0.9.0 is now available.

This is a substantial update focused on entity attributes, categorical state history, More Info graphs and general reliability. It also brings Advanced History closer to a stable v1.0 release.

Advanced History provides a Home Assistant-style History panel powered by the Statistics Graph Chart Card, with target selection, date navigation, bookmarks, graph editing and optional More Info graph replacement.

GitHub repository · Documentation

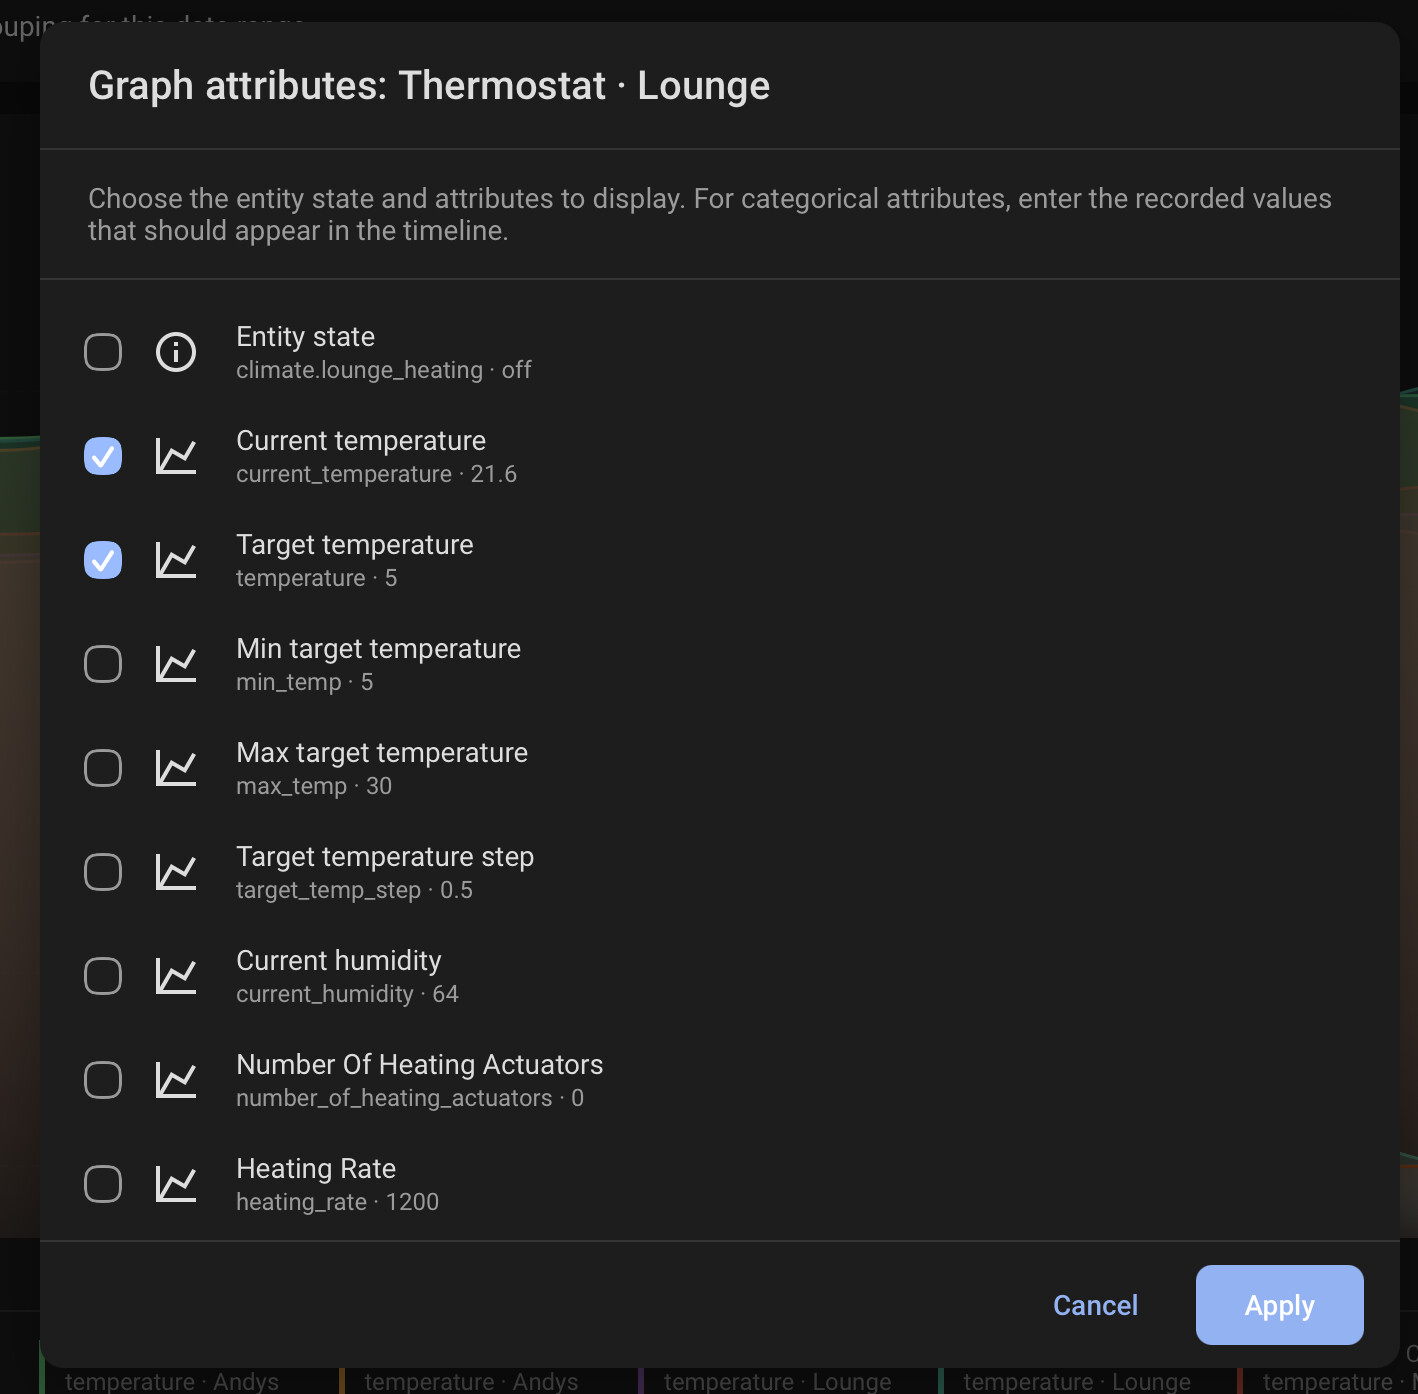
Entity attribute history

You can now select an entity’s state and individual attributes from the target controls.

This includes:

  • Numeric attributes displayed as separate graph series
  • Categorical attributes displayed as State Timelines
  • Multiple attributes from the same entity
  • Independent names, colours and styling for each attribute
  • Attribute selections preserved in bookmarks and chart history
  • Area and attribute names included in labels and tooltips

For example, a climate entity can display its current temperature and target temperature together without adding separate template sensors.

Climate, humidifier and water-heater attributes

Advanced History now provides automatic Home Assistant-style attribute treatment for:

  • Climate: current and target temperature
  • Humidifier: current and target humidity
  • Water heater: current and target temperature

These attributes work in both the main Advanced History panel and More Info graphs.

Domain-specific More Info graphs use native colours and match the size, placement and spacing of standard Advanced History More Info graphs. Each automatic attribute can also be edited independently.

Improved State Timeline history

State Timeline graphs now use raw Home Assistant recorder history across day, week, month, year and custom date ranges.

Native Home Assistant state colours are generated for supported domains and device classes, including:

  • Binary sensors
  • Switches
  • Covers
  • Locks
  • Alarm panels
  • Media players
  • Backup states
  • Calendars
  • Other categorical entities

User-defined state maps still take priority over the automatic mappings.

Timeline segment labels, row labels and legend colours are now handled consistently through Statistics Graph Chart Card v3.32.

More Info History and Activity synchronization

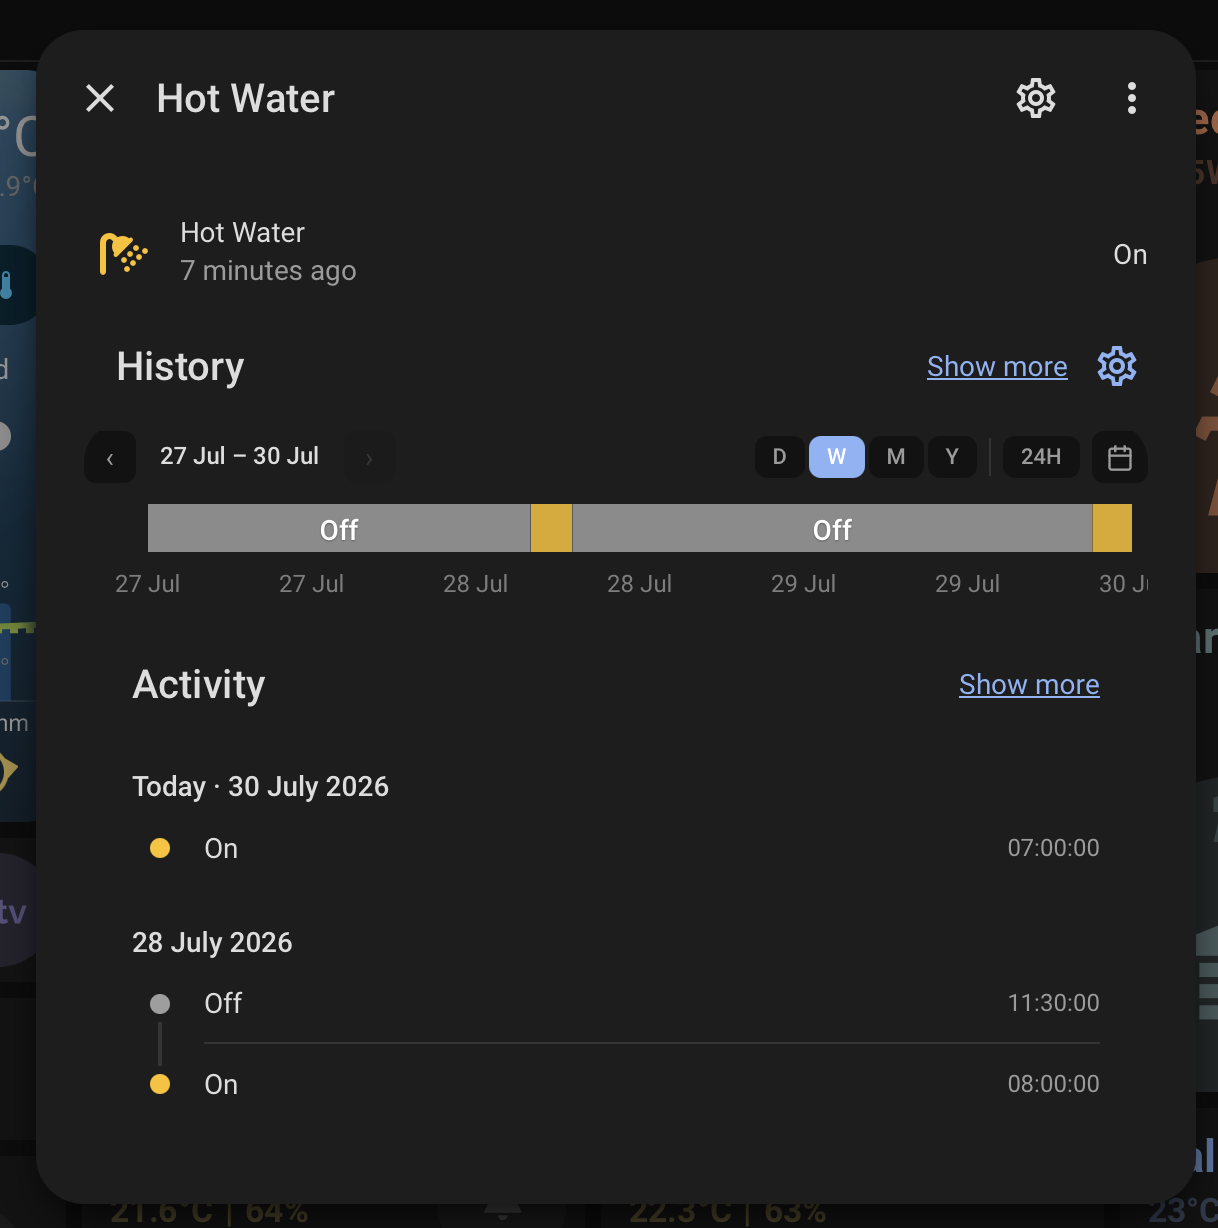
The Activity section in More Info now follows the graph’s selected date range.

Changing between day, week, month, year, rolling 24-hour or custom ranges refreshes both the History graph and Activity list.

More Info graph sizing, spacing and History/Activity alignment have also been refined.

Other improvements

This release also includes:

  • More reliable bookmark change detection
  • Attribute styling preserved in bookmarks
  • Correct bookmark update actions without refreshing
  • Improved saved date-range restoration
  • Dismissible automatic-detail banners
  • Better visual and YAML editor integration
  • Correct entity selectors inside the card editor
  • Automatic merging of newly introduced Card Default options
  • Area-aware names in graphs and the editor
  • Automatic State Timeline sizing
  • Improved frontend cache handling after updates
  • Numerous loading, date synchronization and graph-restoration fixes

API for custom card authors

Advanced History now exposes a public browser API:

window.advancedHistory.openCard()

Compatible custom cards can use this API to open their entities and graph configuration directly in Advanced History.

The API can receive entity IDs, date ranges, attribute selections, comparisons, hidden entities, presentation options and compatible Statistics Graph Chart Card configuration.

Using the API does not make Advanced History a required dependency for the calling card.

Full details are available in the Advanced History card API documentation.

Requirements

  • Home Assistant with custom integration support
  • Statistics Graph Chart Card v3.32 or newer

Using the latest available Statistics Graph Chart Card release is recommended.

Updating from v0.7.0

  1. Update Statistics Graph Chart Card to the latest version through HACS.
  2. Update Advanced History.
  3. Restart Home Assistant.
  4. Reload the Advanced History panel.

New Card Default options are merged automatically into existing configurations while preserving explicitly configured values.

Advanced History remains in pre-release development. If you manually used configuration from an earlier beta:

  • series has been renamed to attributes
  • include_area_on_duplicate_names has been replaced by include_area_names

Thank you to everyone testing Advanced History and reporting issues. Feedback and bug reports are very welcome as the project moves toward v1.0.

Advanced History v1.0.0 — first stable release :tada:

I’m pleased to announce the first stable release of Advanced History for Home Assistant.

Advanced History replaces the standard History panel with a more configurable experience powered by the excellent Statistics Graph Chart Card.

It is now included in the default HACS repository list, so a custom repository is no longer required.

What Advanced History offers

  • Numeric and state-history graphs
  • Entity state and attribute history
  • Multiple attributes from the same entity
  • Numeric and categorical attribute support
  • Climate, humidifier and water-heater attribute graphs
  • Home Assistant-style state colours
  • Per-entity and per-attribute graph configuration
  • Visual and YAML graph editors
  • Bookmarks and chart history
  • Date-range restoration
  • Comparisons
  • Advanced More Info graphs
  • Configurable panel and More Info defaults
  • Shareable links
  • An API for custom card authors

What changed in v1.0.0

Version 1.0.0 focuses on release readiness, documentation and simplifying state-history graph sizing.

  • Advanced History is now available directly from the default HACS repository list.
  • State Timeline graphs now use the graph card’s automatic height calculation.
  • Removed the previous manual state-timeline height calculations.
  • State graphs automatically expand and contract to match their visible rows.
  • Updated the README and documentation with current screenshots and installation instructions.
  • Added integration branding for supported Home Assistant interfaces.
  • Updated the integration version and documentation for the stable release.

Installation

  1. Install or update Statistics Graph Chart Card through HACS. Version 3.32 or newer is required.
  2. Open HACS → Integrations.
  3. Search for Advanced History.
  4. Download it and restart Home Assistant.
  5. Open Settings → Devices & services → Add integration and select Advanced History.

Existing users can update normally through HACS. Restart Home Assistant after updating, then perform a hard refresh if an older frontend bundle remains cached.

Links

Thank you to everyone who tested the earlier releases, reported issues and provided feedback.

Feedback and bug reports are still very welcome.