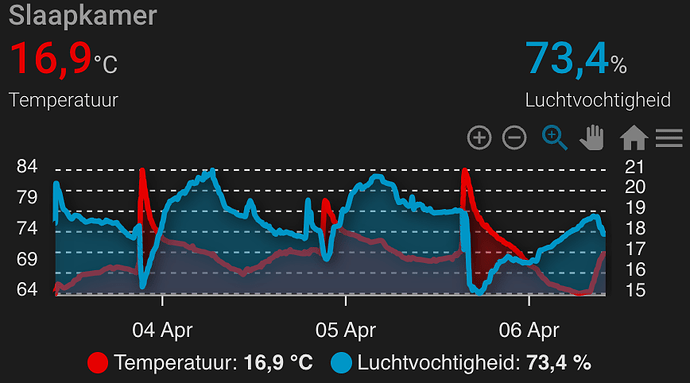
Hi all,
I’m new here, so still learning the customs on this forum.
I have an issue with (the fantastic add-on!) Apex charts. In card configuration, some of the sensors are not found, resulting in the error message “Entity not available: sensor.aqara_temp_hum_slaapkamer_kimly_onno_temperatuur”.
If I call the sensor in the HA native chart card, it does show correctly.
I bought 4 identical Aqara sensors, only this one doesn’t show.
I’ll try add some pictures below.
Not urgent but nice to know:
- I’d like to have the y-axis metrics on each side (instead of both left)
- on my phone the graph doesn’t fit. Did anyone find an option to reduce the graph’s width?
The bathroom sensors do work, For this I use the following code:
type: custom:apexcharts-card
graph_span: 72h
yaxis:
  - id: _temperatuur
    decimals: 0
    apex_config:
      tickAmount: 6
  - id: _luchtvochtigheid
    decimals: 0
    apex_config:
      tickAmount: 4
apex_config:
  chart:
    zoom:
      type: x
      enabled: true
      autoScaleYaxis: false
    dropShadow:
      enabled: true
    toolbar:
      show: true
      autoSelected: zoom
    xaxis.type: datetime
    height: 250px
color_list:
  - '#E60000'
  - '#0096C7'
all_series_config:
  stroke_width: 3
  opacity: 0.3
  type: area
header:
  show: true
  title: BADKAMER (slaapkamer entiteiten zijn verdwenen??)
  show_states: true
  colorize_states: true
series:
  - entity: sensor.aqara_temp_hum_badkamer_temperatuur
    yaxis_id: _temperatuur
    data_generator: ''
    curve: smooth
    name: Temperatuur
  - entity: sensor.aqara_temp_hum_badkamer_luchtvochtigheid
    yaxis_id: _luchtvochtigheid
    data_generator: ''
    curve: smooth
    invert: false
    name: Luchtvochtigheid
Ouch: solved it. I made a typo creating the bedroom sensors, thats why it doesn’t show up after “sensor.aqara_temp_hum_…”. My bad!
The width-issue on a mobile device is solved by reducing the height: that way the width is also reduced.
Having the y-axis-metrics on both sides is actually quite easy after some googling: ad “opposite: true” to yaxis_id. This man is very happy!
type: custom:apexcharts-card
graph_span: 72h
yaxis:
  - id: _temperatuur
    decimals: 0
    opposite: true
    apex_config:
      tickAmount: 6
  - id: _luchtvochtigheid
    decimals: 0
    apex_config:
      tickAmount: 4
apex_config:
  chart:
    zoom:
      type: x
      enabled: true
      autoScaleYaxis: false
    dropShadow:
      enabled: true
    toolbar:
      show: true
      autoSelected: zoom
    xaxis.type: datetime
    height: 150px
color_list:
  - '#E60000'
  - '#0096C7'
all_series_config:
  stroke_width: 3
  opacity: 0.3
  type: area
header:
  show: true
  title: Slaapkamer
  show_states: true
  colorize_states: true
series:
  - entity: sensor.aqara_temp_lum_slaapkamer_kimly_onno_temperatuur
    yaxis_id: _temperatuur
    data_generator: ''
    curve: smooth
    name: Temperatuur
  - entity: sensor.aqara_temp_lum_slaapkamer_kimly_onno_luchtvochtigheid
    yaxis_id: _luchtvochtigheid
    data_generator: ''
    curve: smooth
    invert: false
    name: Luchtvochtigheid

type or paste code here

