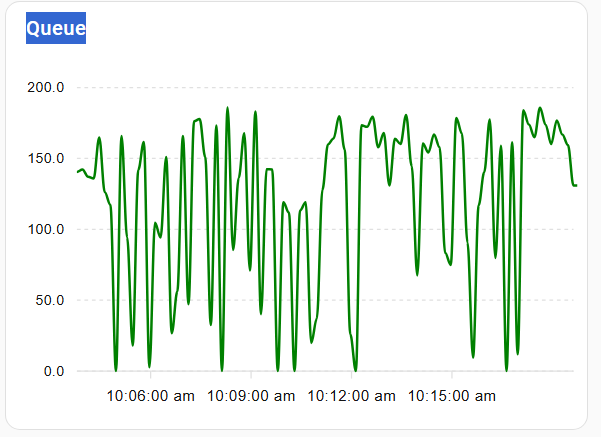
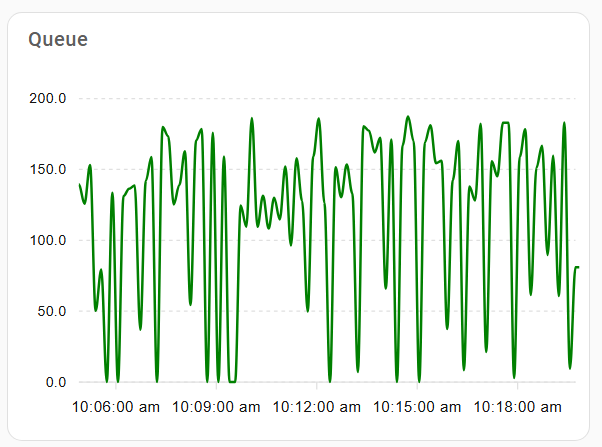
I use Apex Chart to visualization my real time bandwidth usage.
The update interval set to 1s and if we see in the picture the line is not same for previous second, seem the value is changed.
Here my config
type: custom:apexcharts-card
graph_span: 15m
header:
  title: Queue
  show: true
all_series_config:
  stroke_width: 2
  type: line
update_interval: 1s
series:
  - entity: sensor.test1_queue_in_mbps
    name: test1
    color: green
    group_by:
      func: last
      duration: 10s