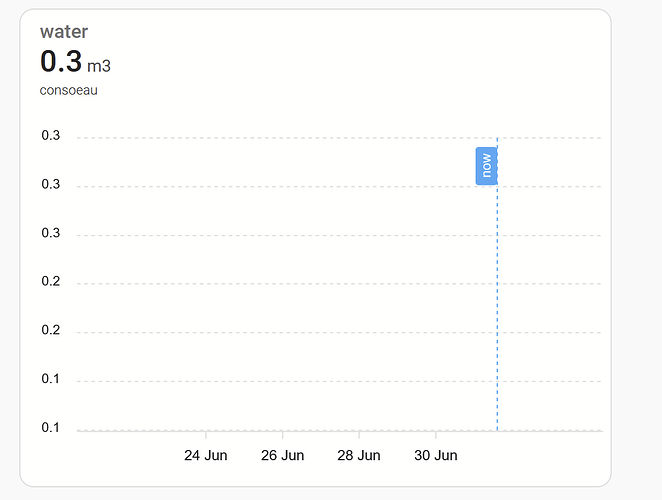
Apexchart need help

Hi

I have a sensor that have attributes value (day to day).

With apexchart i try to graph day to day consumption

i did that

type: custom:apexcharts-card
update_interval: 1m
graph_span: 7d
span:
  end: day
  offset: '-1day'
header:
  show: true
  title: water
  show_states: true
now:
  show: true
  label: now
apex_config:
  legend:
    show: false
series:
  - entity: sensor.consoeau
    type: column
    unit: m3
    show:
      in_header: true
    data_generator: |
      return entity.attributes.conso.map((entry) => {
         return [new Date(entry.endDate), entry.value];
       });

Unfortunatly the chart stay empty

please help me
thanks

You need to add an offset of (about) -30d as the data is in the past and the chart shows today

EDIT:…nope…start : day

type: custom:apexcharts-card
header:
  show: true
  title: water
  show_states: true
graph_span: 7d
span:
  start: day
  offset: '-30day'
now:
  show: true
  label: now
apex_config:
  legend:
    show: false
series:
  - entity: sensor.testconso
    type: column
    show:
      in_header: true
    data_generator: |
      return entity.attributes.conso.map((entry) => {
         return [new Date(entry.endDate), entry.value];
       });

Amazing ! Many Thanks
One last point
the value is one digit after the digital point,
i would like to have 2 digits after the decimal point

float_precision: 2
thx