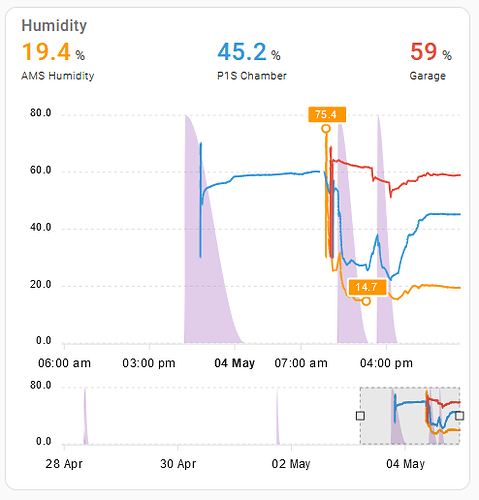
Starting out with ApexCharts and was playing around with the transform function and was wondering how I can get the state(shown in purple, sensor.bambu_lab_p1s_print_status) to area graph as a solid bar. Currently it’s graphing with a slope down to when the state changes from ‘running’ to ‘finished’. I’m new to YAML, so apologies if this is a dumb question.
Thanks!
type: custom:apexcharts-card
apex_config:
  legend:
    show: false
header:
  show: true
  title: Humidity
  show_states: true
  colorize_states: true
graph_span: 7d
all_series_config:
  stroke_width: 2
  opacity: 1
  show:
    in_brush: true
experimental:
  brush: true
series:
  - entity: sensor.bambu_lab_ams_temp_humidity_sensor_humidity_2
    type: line
    name: AMS Humidity
    show:
      extremas: true
      legend_value: false
  - entity: sensor.bambu_lab_p1s_chamber_temp_humidty_sensor_humidity
    type: line
    name: P1S Chamber
    show:
      extremas: false
      legend_value: false
  - entity: sensor.garage_temp_humidity_sensor_humidity_3
    type: line
    name: Garage
    show:
      extremas: false
      legend_value: false
  - entity: sensor.bambu_lab_p1s_print_status
    type: area
    transform: 'return x=== ''running'' ? 80: 0;'
    name: Print Status
    opacity: 0.3
    stroke_width: 0
    show:
      in_header: false
      legend_value: false
