@Ideefiks Thanks! I solved it creating a template sensor with a float * -1. This did the trick.
But now I have another problem, I get some kind of ‘ghosting’. See the blue under the red arrow. This is a ghost from a few hours before.
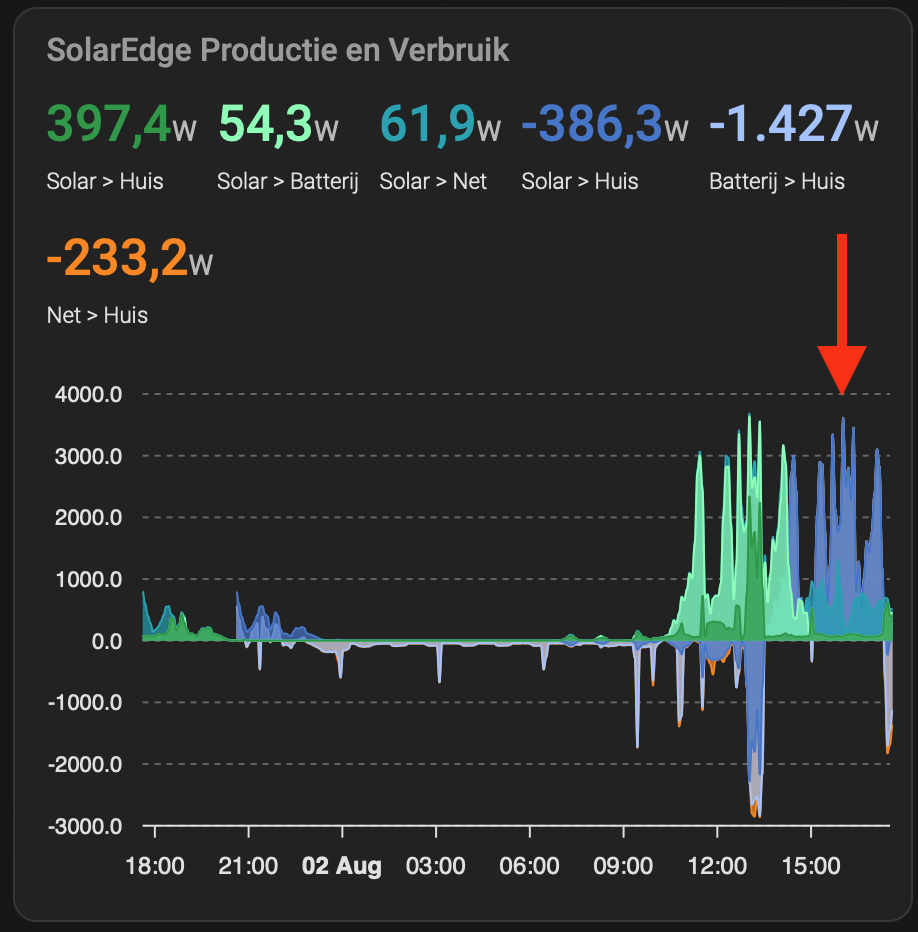
I had this problem before, but solved it with a cache: false. This doesn’t seem to work now. Anyone idea’s?
type: custom:apexcharts-card
graph_span: 24h
update_interval: 5min
cache: false
apex_config:
  chart:
    stacked: true
    stackOnlyBar: false
  legend:
    show: false
  grid:
    show: true
    borderColor: "#666666"
all_series_config:
  stroke_width: 1
  type: area
  group_by:
    func: avg
    duration: 5m
header:
  show: true
  title: SolarEdge Productie en Verbruik
  show_states: true
  colorize_states: true
series:
  - entity: sensor.solar_panel_to_house_w
    color: "#009a40"
    name: Solar > Huis
  - entity: sensor.solar_panel_to_battery_w
    color: "#80ffb5"
    name: Solar > Batterij
  - entity: sensor.solar_panel_to_grid_w
    color: "#00a3b3"
    name: Solar > Net
  - entity: sensor.solar_panel_to_house_w_negative
    color: "#4774cc"
    name: Solar > Huis
  - entity: sensor.solar_battery_to_house_w_negative
    color: "#a6c3ff"
    name: Batterij > Huis
  - entity: sensor.solar_grid_to_house_w_negative
    color: "#ff8800"
    name: Net > Huis