Ooooh! Some more tinkering, and it seems that you need to add grid_options to the apexcharts block, e.g.:
  - type: custom:apexcharts-card
    grid_options:
      columns: full
    [...]
However, now I’m not sure how to set the height. One of my graphs is over twice the height of the other one:
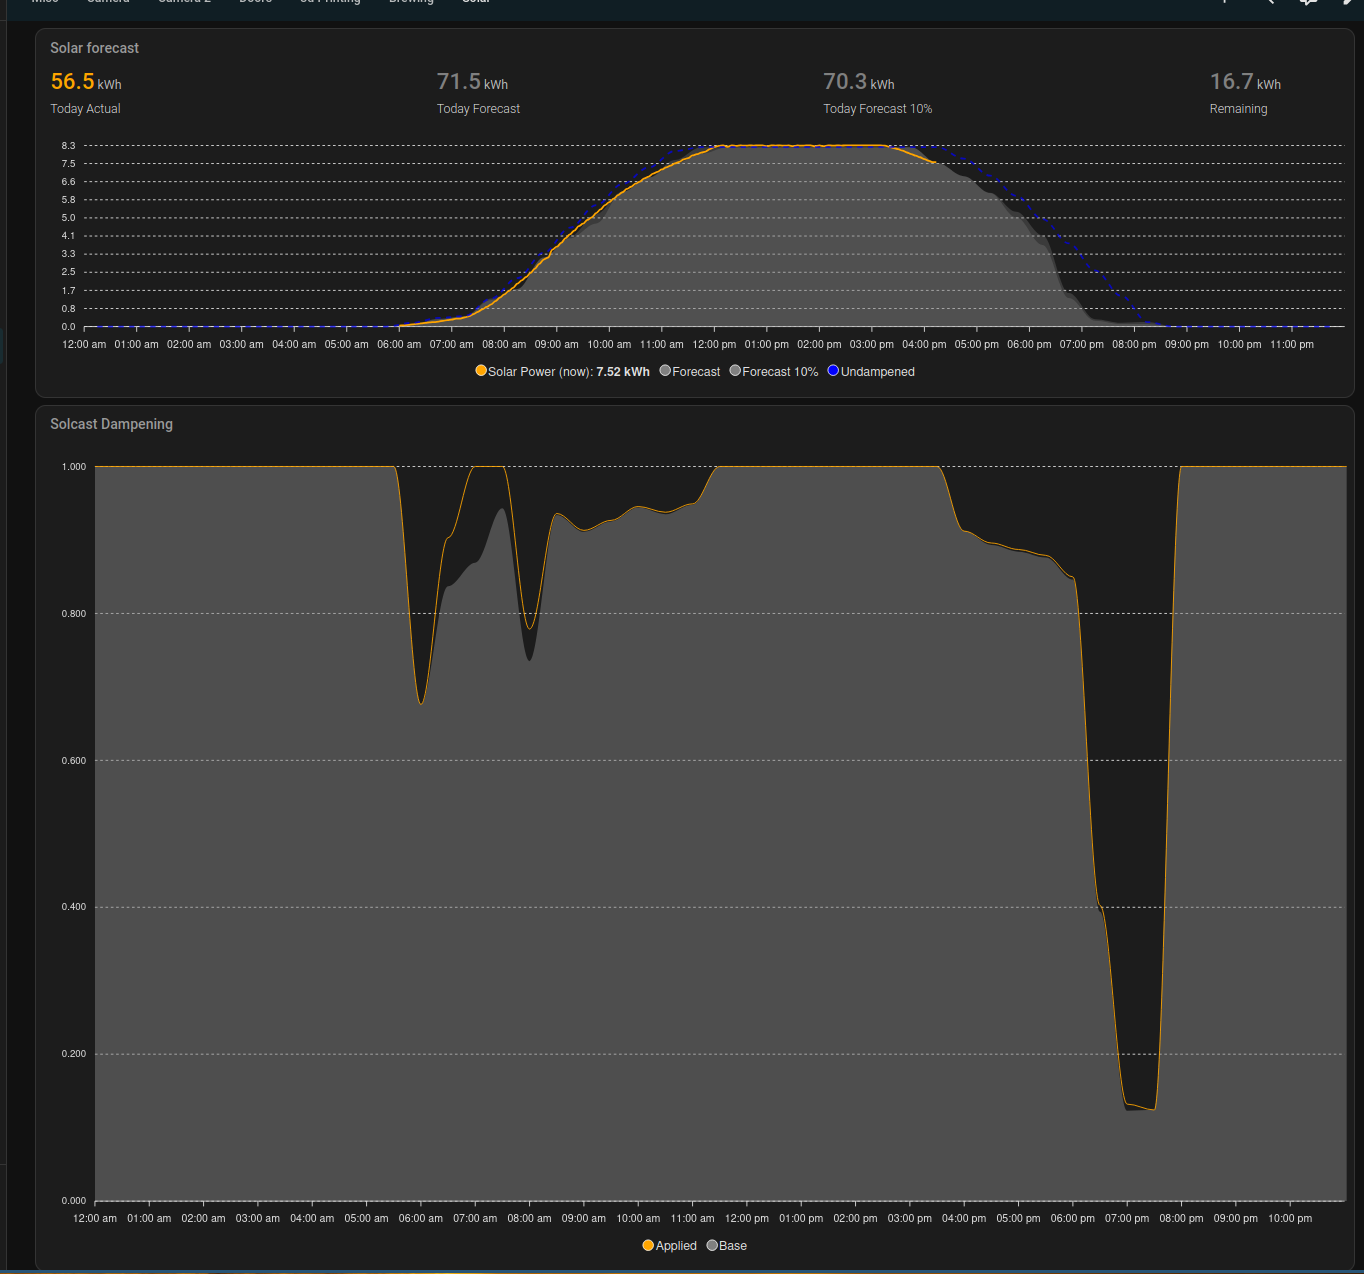
type: sections
title: Solar
path: solar
sections:
  - type: grid
    square: false
    cards:
      - type: custom:apexcharts-card
        grid_options:
          columns: full
          rows: auto
        header:
          title: Solar forecast
          show: true
          show_states: true
          colorize_states: true
        apex_config:
          chart:
            height: 300px
          tooltip:
            enabled: true
            shared: true
            followCursor: true
        graph_span: 24h
        span:
          start: day
        yaxis:
          - id: capacity
            show: false
            opposite: true
            decimals: 0
            max: 100
            min: 0
            apex_config:
              tickAmount: 10
          - id: kWh
            show: true
            min: 0
            apex_config:
              tickAmount: 10
          - id: header_only
            show: false
        series:
          - entity: >-
              sensor.power_photovoltaics_fronius_power_flow_0_fronius_rancho_relaxo
            name: Solar Power (now)
            type: line
            stroke_width: 2
            float_precision: 2
            color: Orange
            yaxis_id: kWh
            transform: return x / 1000;
            unit: kWh
            extend_to: now
            show:
              legend_value: true
              in_header: false
            group_by:
              func: avg
              duration: 5m
          - entity: sensor.solcast_pv_forecast_forecast_today
            name: Forecast
            color: Grey
            opacity: 0.3
            stroke_width: 0
            type: area
            time_delta: +15min
            extend_to: false
            yaxis_id: kWh
            show:
              legend_value: false
              in_header: false
            data_generator: |
              return entity.attributes.detailedForecast.map((entry) => {
                    return [new Date(entry.period_start), entry.pv_estimate];
                  });
          - entity: sensor.solcast_pv_forecast_forecast_today
            name: Forecast 10%
            color: Grey
            opacity: 0.3
            stroke_width: 0
            type: area
            time_delta: +15min
            extend_to: false
            yaxis_id: kWh
            show:
              legend_value: false
              in_header: false
            data_generator: |
              return entity.attributes.detailedForecast.map((entry) => {
                    return [new Date(entry.period_start), entry.pv_estimate10];
                  });
          - entity: sensor.solcast_pv_forecast_forecast_today
            name: Undampened
            color: Blue
            opacity: 0.7
            stroke_width: 2
            stroke_dash: 6
            type: line
            time_delta: +15min
            extend_to: false
            yaxis_id: kWh
            show:
              legend_value: false
              in_header: false
              in_chart: true
            data_generator: |
              return entity.attributes.detailedForecast.map((entry) => {
                    return [new Date(entry.period_start), entry.pv_estimate/entry.dampening_factor];
                  });
          - entity: sensor.energy_day_fronius_inverter_1_fronius_rancho_relaxo
            yaxis_id: header_only
            name: Today Actual
            stroke_width: 2
            color: Orange
            transform: return x / 1000;
            unit: kWh
            show:
              legend_value: true
              in_header: true
              in_chart: false
          - entity: sensor.solcast_pv_forecast_forecast_today
            yaxis_id: header_only
            name: Today Forecast
            color: Grey
            show:
              legend_value: true
              in_header: true
              in_chart: false
          - entity: sensor.solcast_pv_forecast_forecast_today
            attribute: estimate10
            yaxis_id: header_only
            name: Today Forecast 10%
            color: Grey
            opacity: 0.3
            show:
              legend_value: true
              in_header: true
              in_chart: false
          - entity: sensor.solcast_pv_forecast_forecast_remaining_today
            yaxis_id: header_only
            name: Remaining
            color: Grey
            show:
              legend_value: true
              in_header: true
              in_chart: false
    column_span: 3
  - type: grid
    square: false
    cards:
      - type: custom:apexcharts-card
        header:
          show: true
          title: Solcast Dampening
          show_states: false
        apex_config:
          legend:
            show: true
          tooltip:
            "y":
              formatter: |
                EVAL:function(y) {return y.toFixed(3);}
            enabled: true
            marker:
              show: false
        graph_span: 23h
        span:
          start: day
        yaxis:
          - min: 0
            max: 1
            decimals: 3
            apex_config:
              tickAmount: 5
        series:
          - entity: sensor.solcast_pv_forecast_forecast_today
            name: Applied
            color: orange
            stroke_width: 1
            type: line
            show:
              legend_value: false
              in_header: false
            data_generator: |
              const factors = entity.attributes.detailedForecast;
              return factors.map(entry => {
                return {
                  x: entry.period_start,
                  y: entry.dampening_factor
                };
              });
          - entity: sensor.solcast_pv_forecast_dampening
            name: Base
            color: grey
            stroke_width: 0
            opacity: 0.5
            type: area
            show:
              legend_value: false
              in_header: false
            data_generator: >
              const factors = entity.attributes.factors; const now = new Date();
              // local time (browser)

              return factors.map(({ interval, factor }) => {
                const [h, m] = interval.split(':').map(Number);
                // Build a Date for "today" at the given hh:mm in local time
                const x = new Date(
                  now.getFullYear(), now.getMonth(), now.getDate(), h, m
                ).getTime(); // epoch ms for ApexCharts

                return { x, y: factor };
              });
        grid_options:
          columns: full
          rows: auto
    column_span: 3
  - type: grid
    cards:
      - type: heading
        heading: New section
max_columns: 3
cards: []
header:
  layout: start
  badges_position: bottom
  badges_wrap: wrap