Hello Home Assistant community,
this is my first post. I got my home assistant a few weeks ago and already found plenty of help here in the forum. However, I still got a problem with the Apexcharts-card.
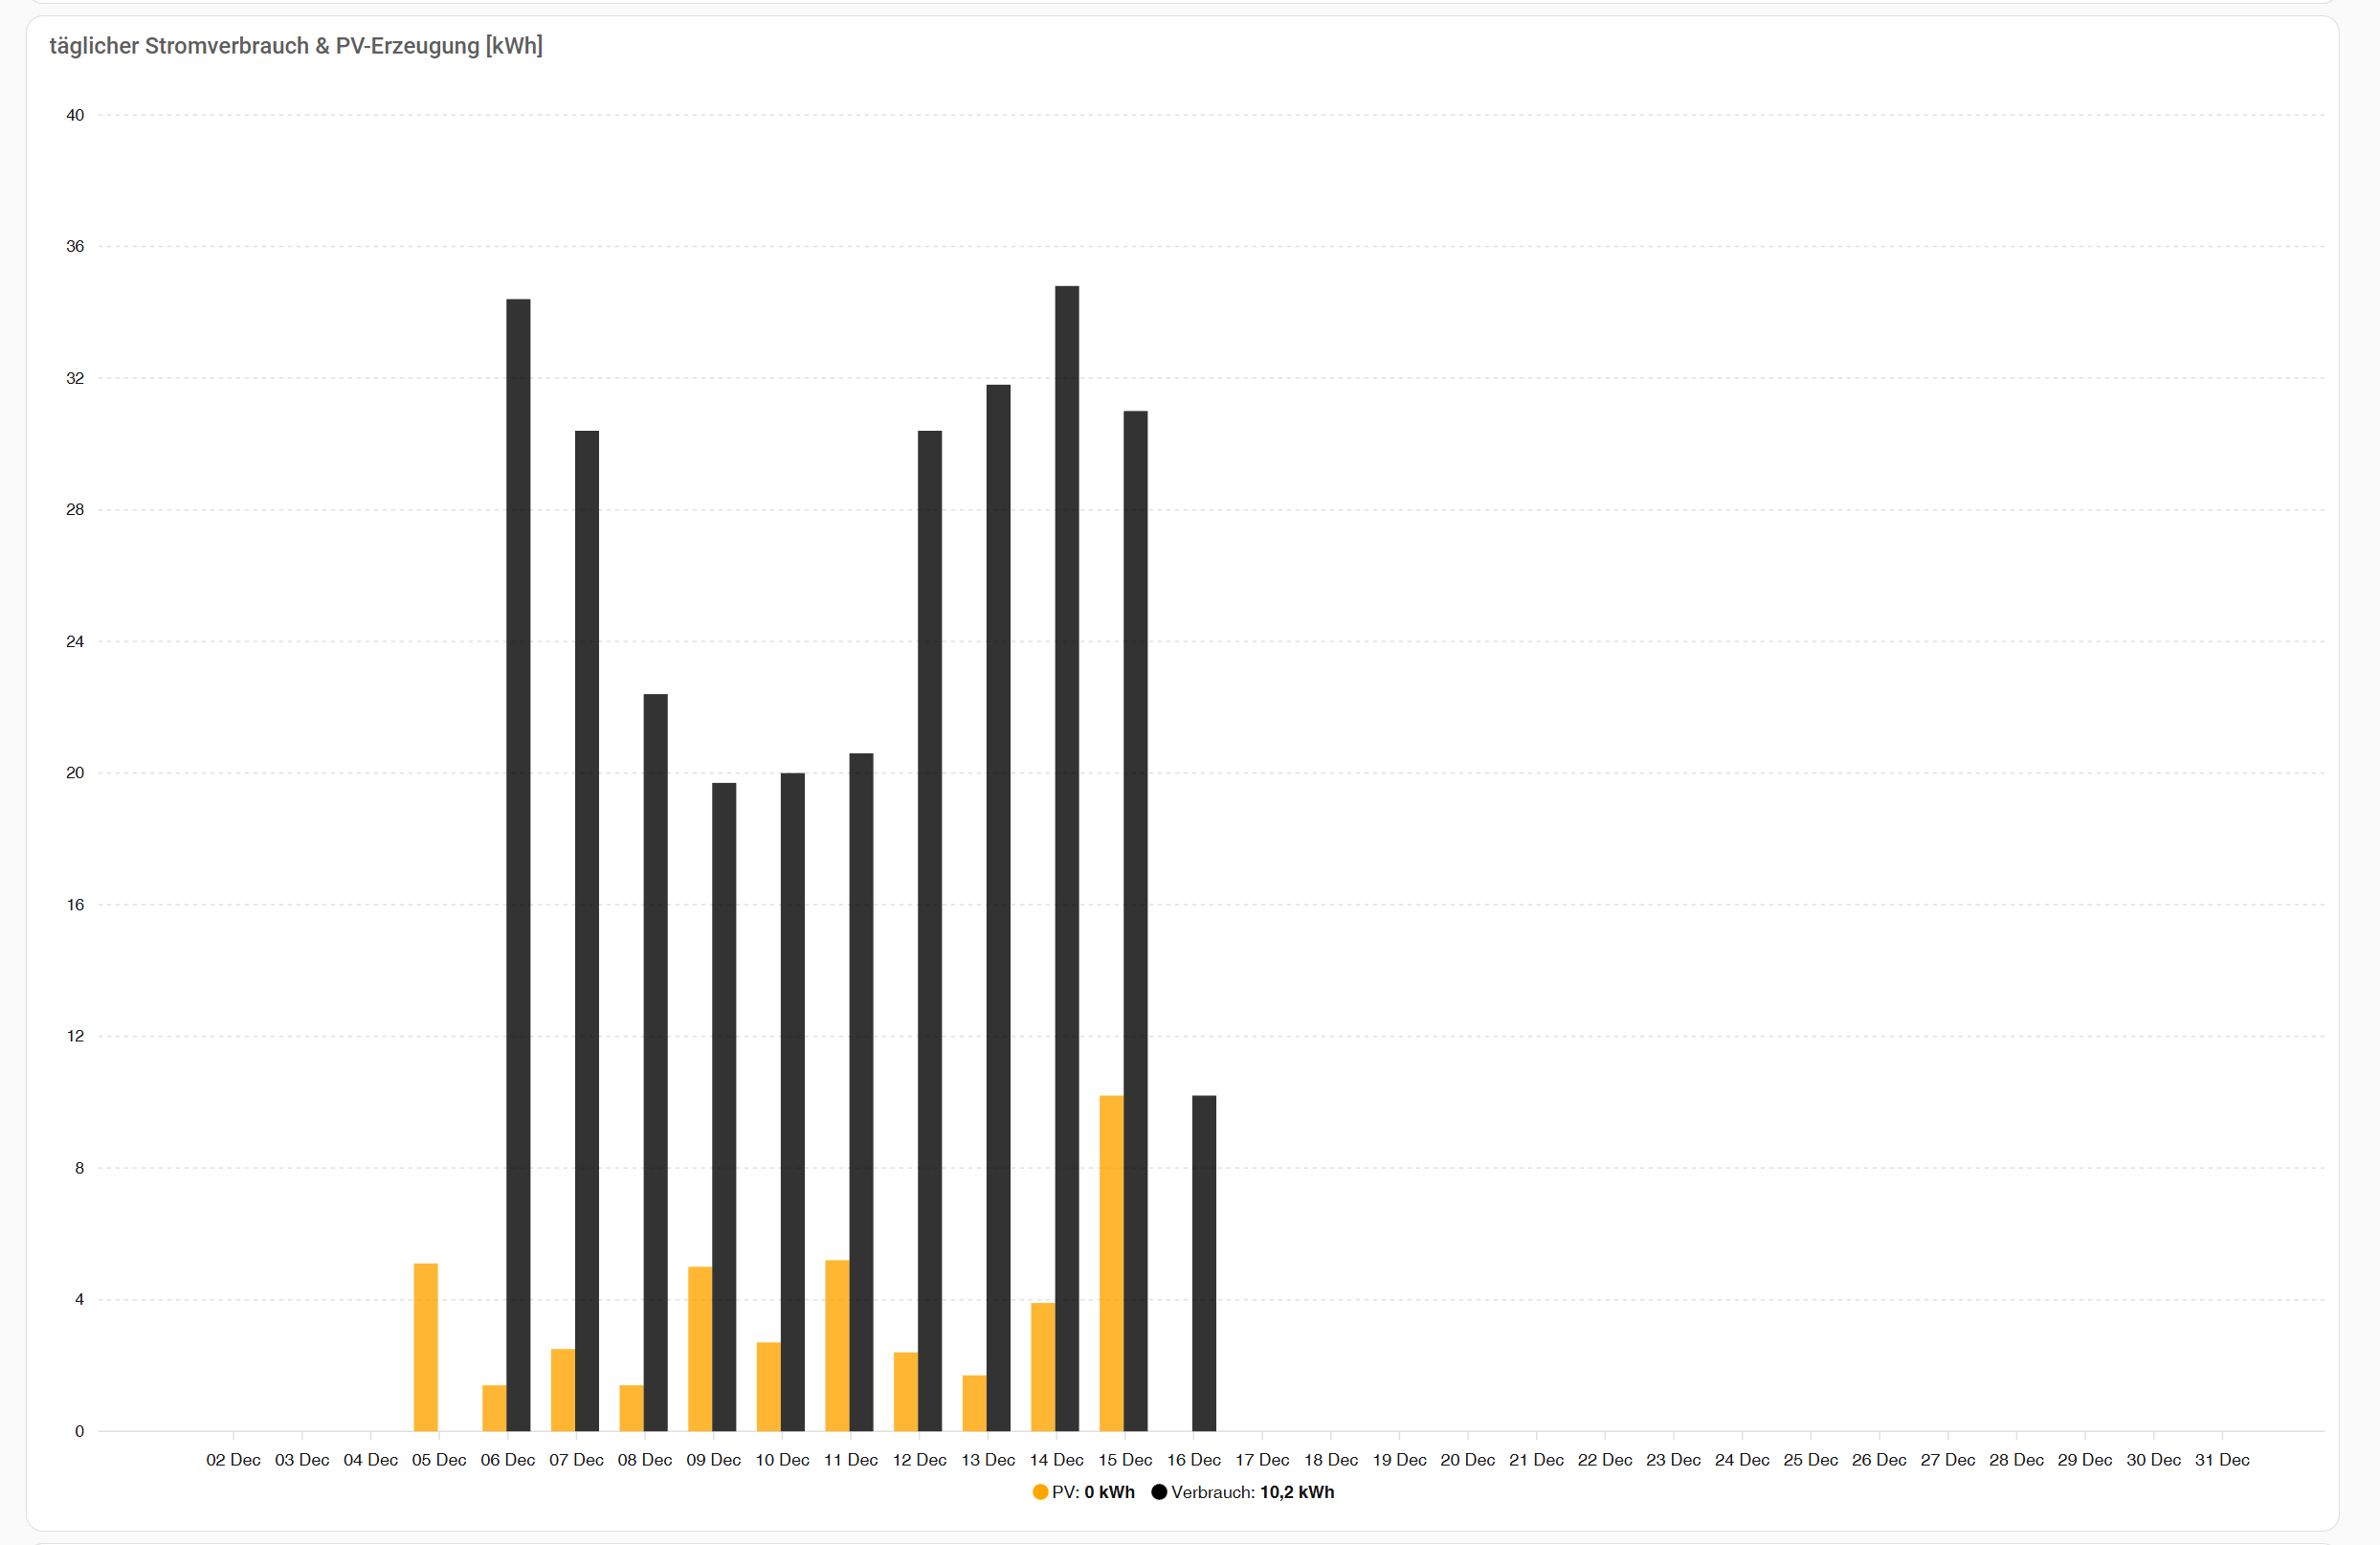
When changing the span end from days to month the values from a long time statistics sensor are no longer shown and only the last 10 days are displayed.
Here is my code (with span end set to day):
type: custom:apexcharts-card
header:
  show: true
  title: täglicher Stromverbrauch & PV-Erzeugung [kWh]
graph_span: 1month
span:
  end: day
yaxis:
  - min: 0
    max: ~10
    decimals: 0
    align_to: 10
    apex_config:
      tickAmount: 10
series:
  - entity: sensor.goodwe_today_s_pv_generation
    color: orange
    opacity: 0.8
    type: column
    name: PV
    show:
      datalabels: false
    group_by:
      func: last
      duration: 1d
  - entity: sensor.goodwe_today_load
    color: black
    opacity: 0.8
    type: column
    name: Verbrauch
    show:
      datalabels: false
    group_by:
      func: last
      duration: 1d
Here is an Image with span end set to day:
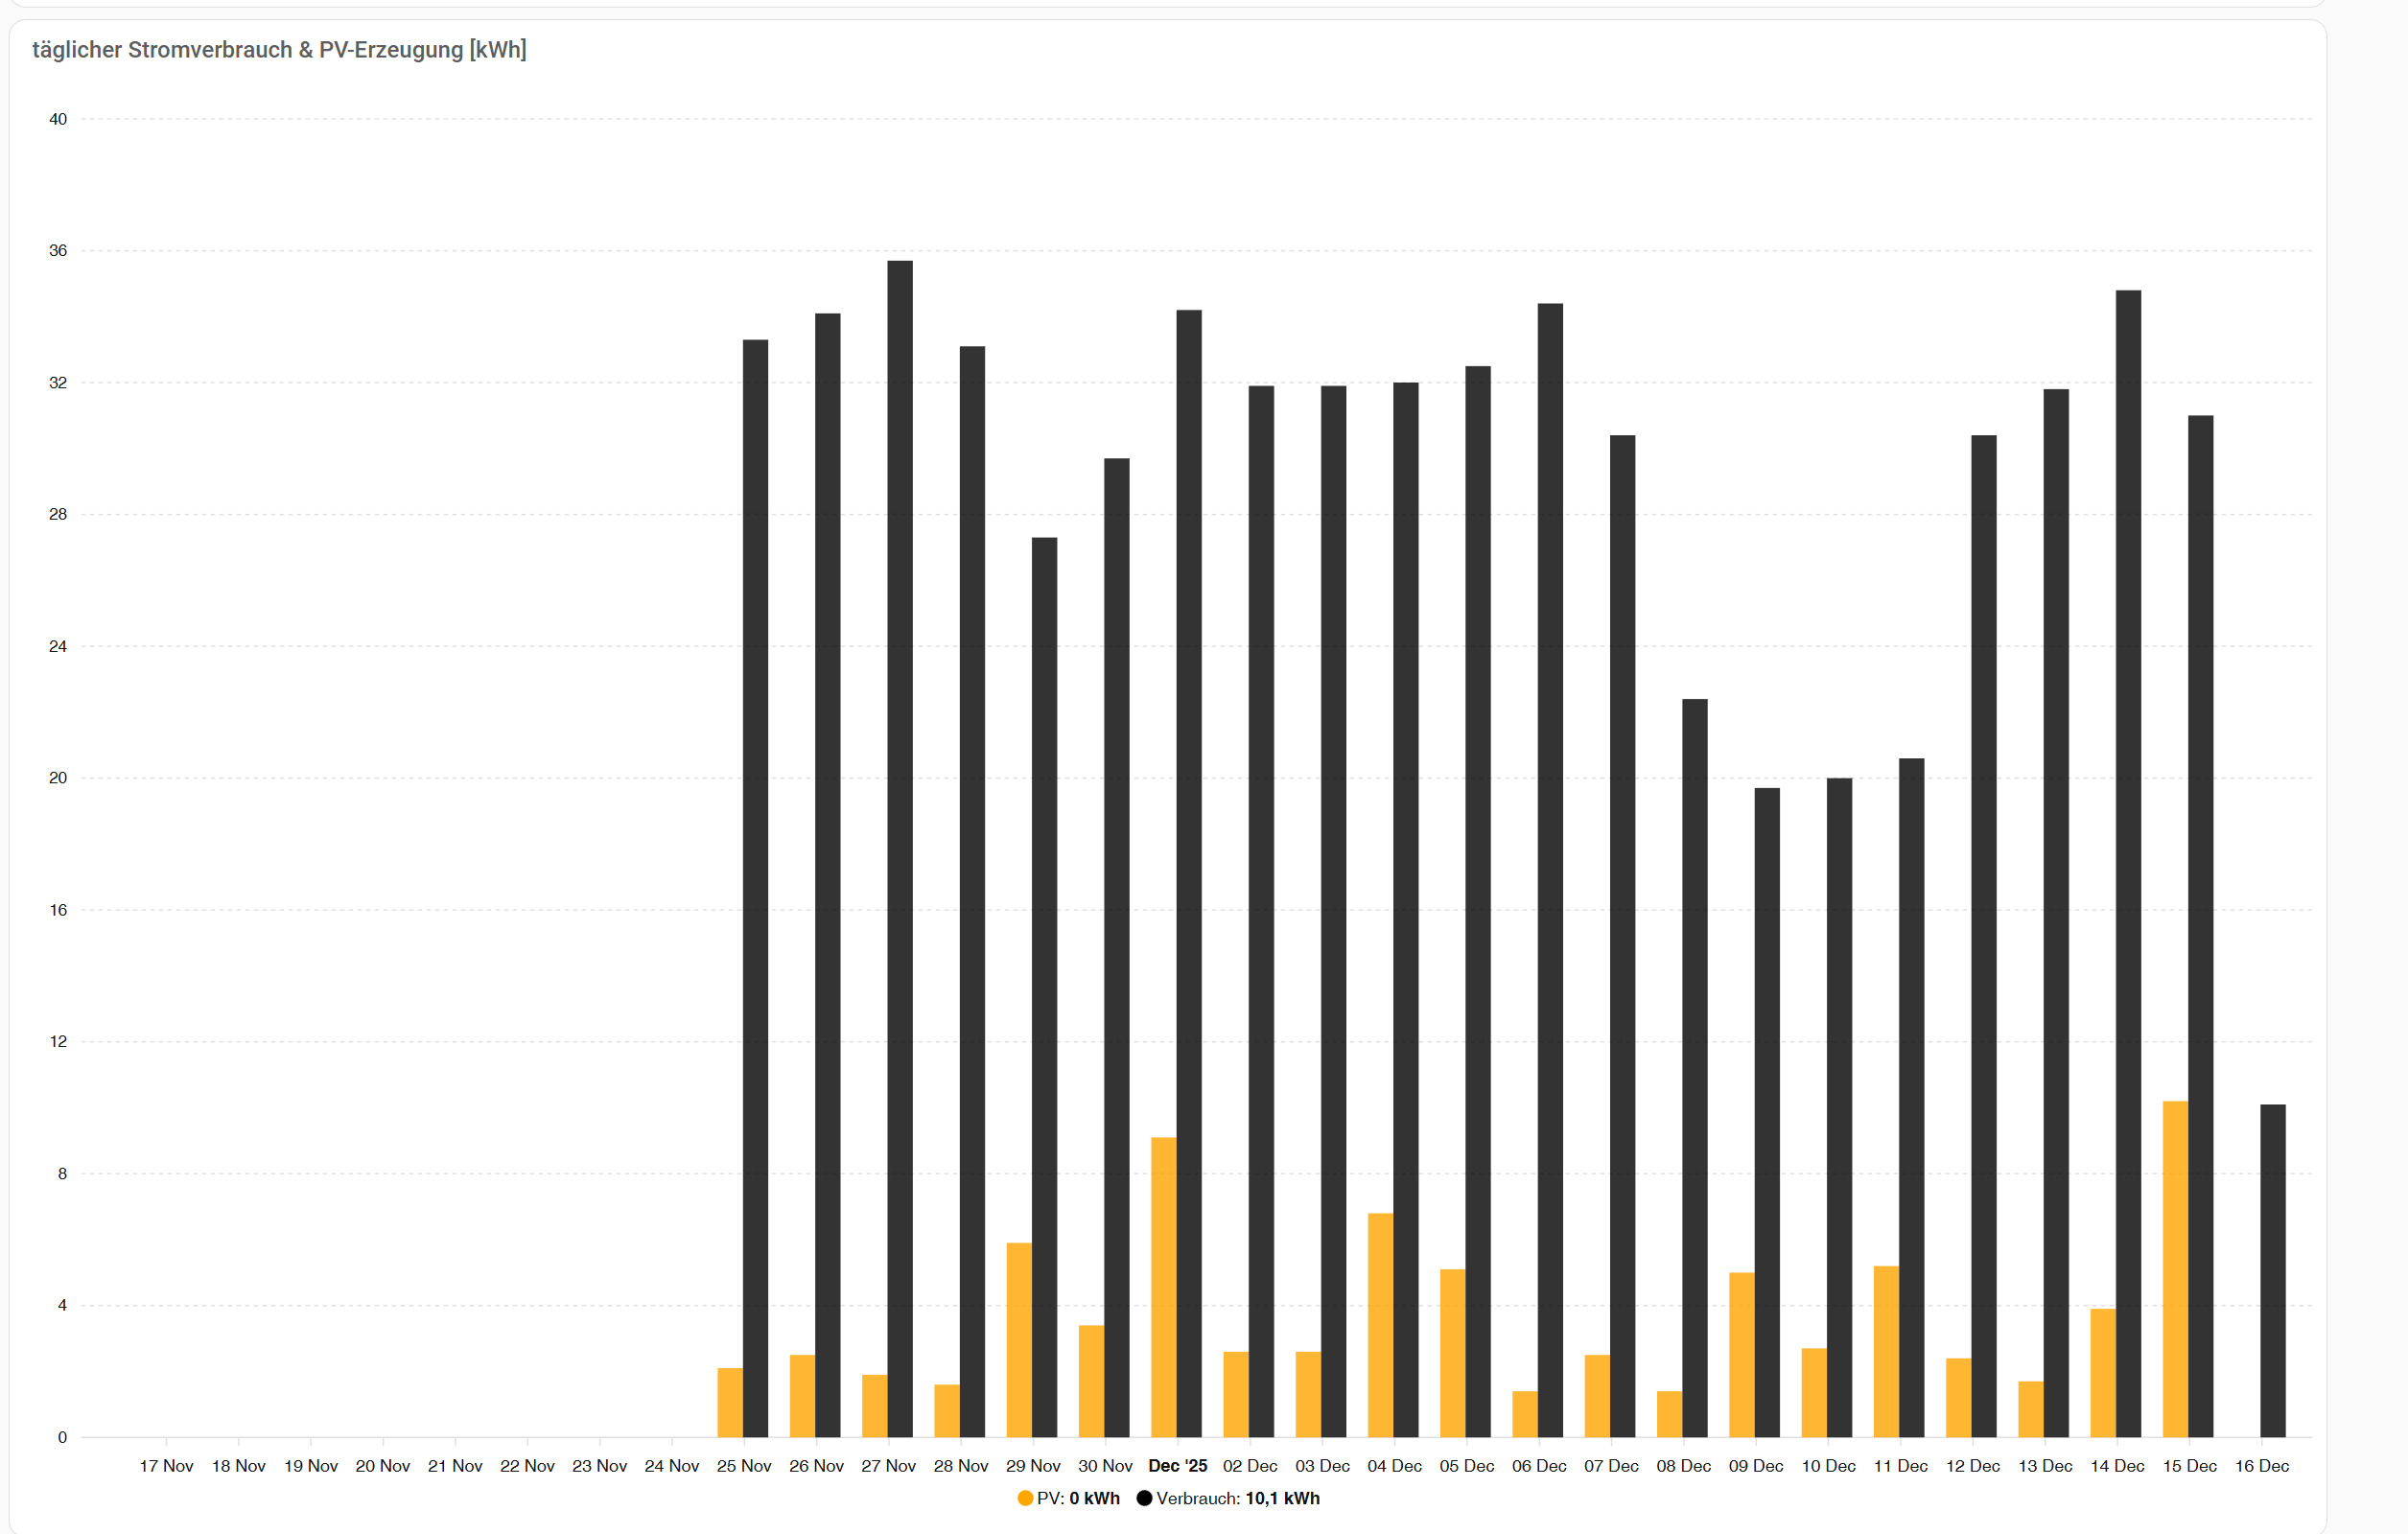
As a new user I am not allowed to upload another image. I uploaded it with a second post.
The problem is present on both my computer and my smartphone. Is there a way to fix this?