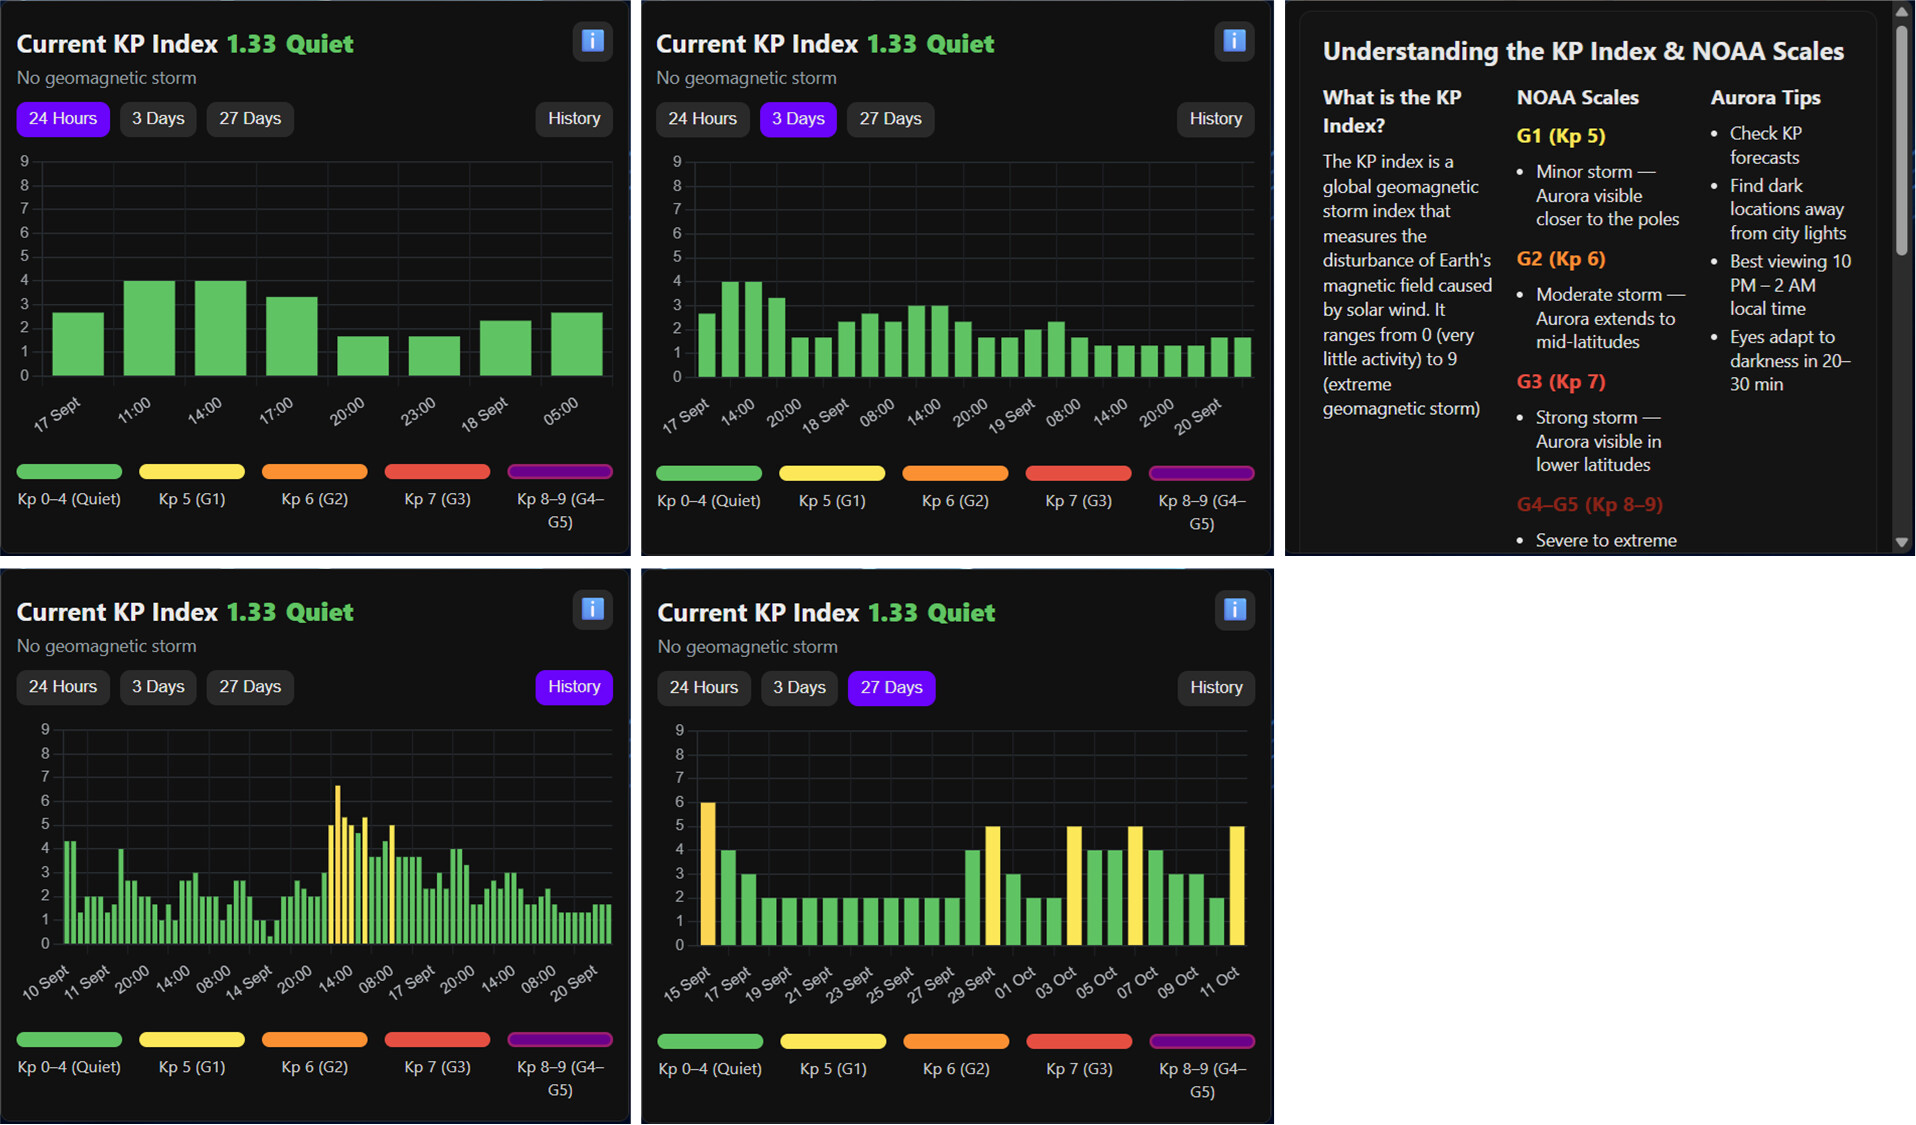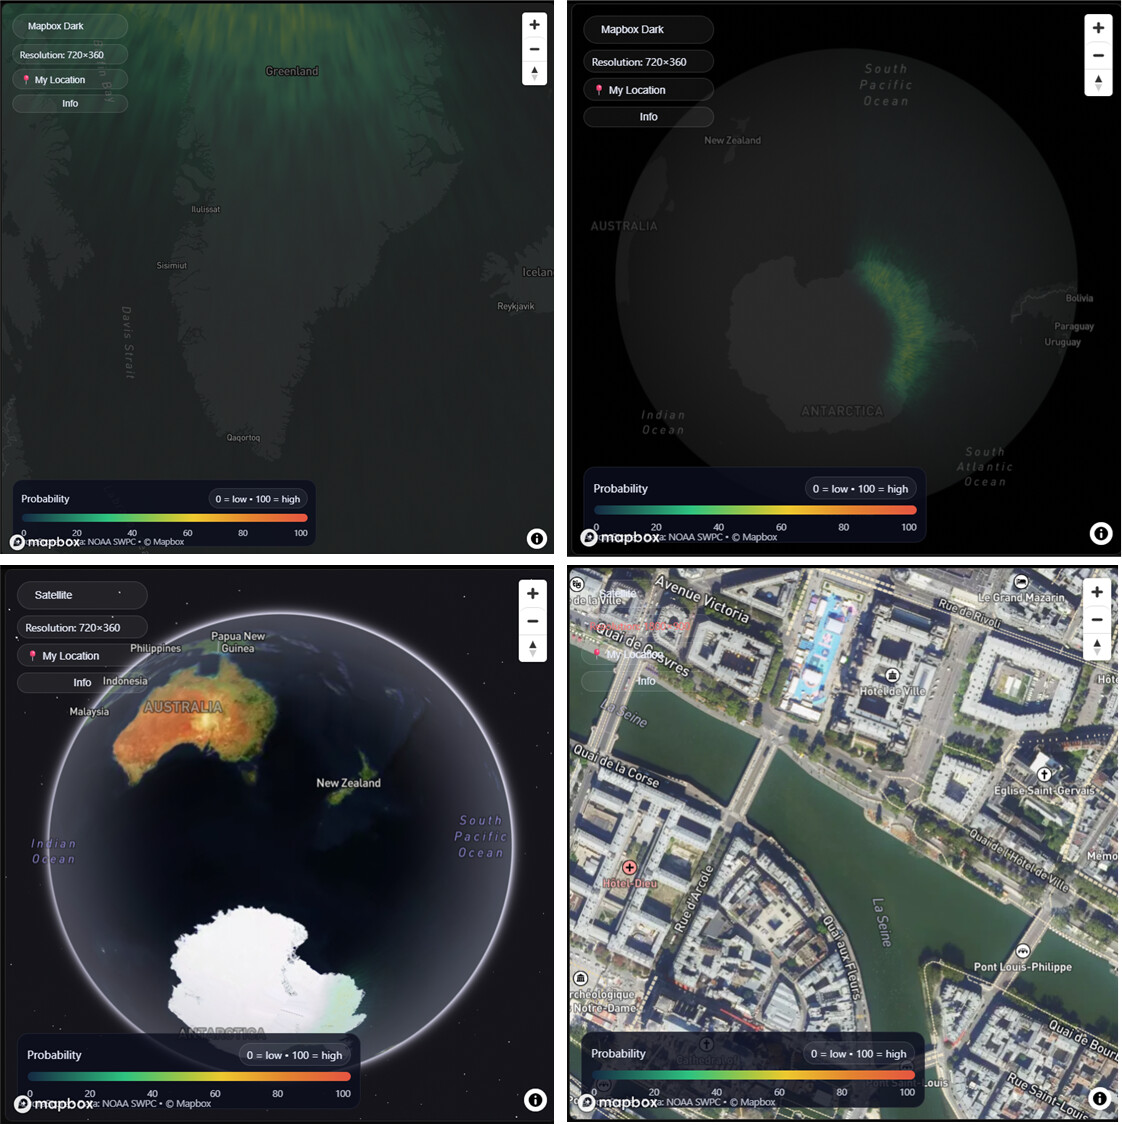
 Aurora Map Card — NOAA OVATION 24h Animation
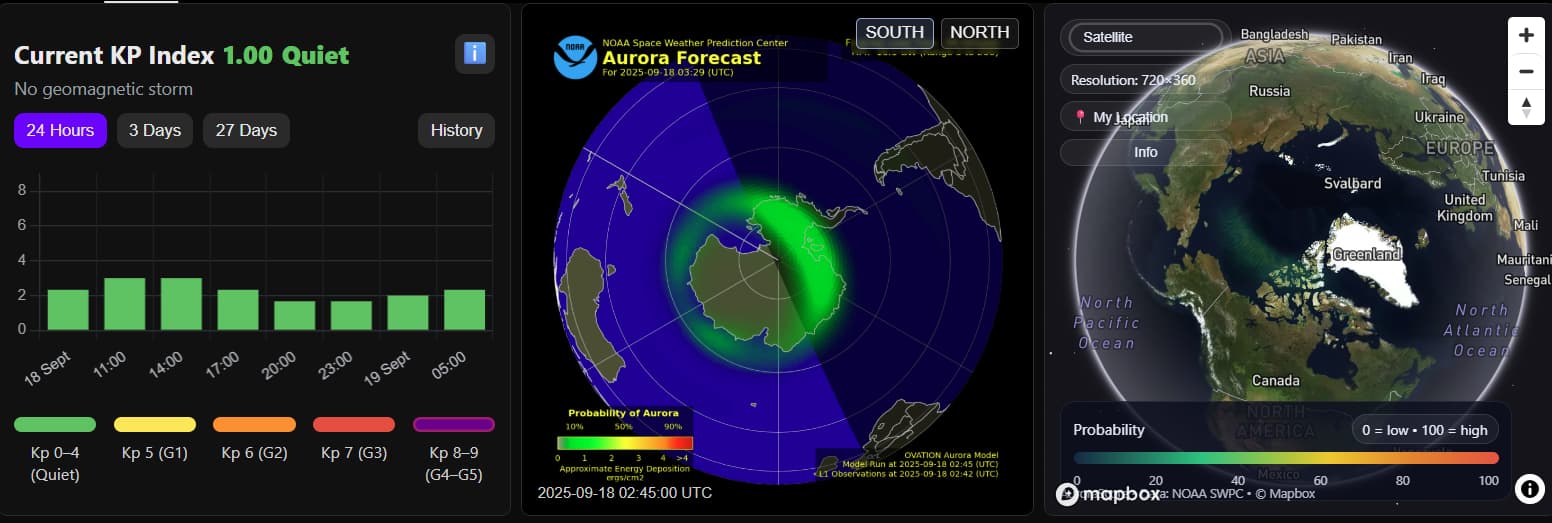
This custom card shows a smooth 24-hour playback of the NOAA SWPC OVATION aurora forecast, directly in Home Assistant.
You can switch between South and North hemispheres and optionally remember your default.
 Installation
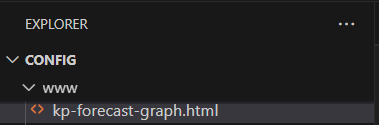
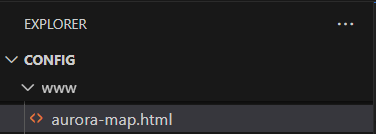
- Create the file
/config/www/aurora-map.html
- (Create the
wwwfolder if it doesn’t already exist.)
- Copy the entire below code snippet into the file you just created
AURORA MAP CARD CODE aurora-map.html
<!doctype html>
<html lang="en">
<head>
  <meta charset="utf-8" />
  <meta name="viewport" content="width=device-width,initial-scale=1" />
  <title>Aurora South – 24h (filename-only)</title>
  <style>
    :root { color-scheme: dark; }
    html,body { height:100%; }
    html,body { margin:0; background:#000; color:#e6e6e6; font:14px/1.4 system-ui,Segoe UI,Roboto; }
    body.centerY { min-height:100vh; display:flex; align-items:center; }
    body.pinTop  { min-height:100vh; display:flex; align-items:flex-start; }
    *, *::before, *::after { box-sizing: border-box; }

    /* Container width like KP card */
    .wrap { width: min(960px, 100%); margin-inline:auto; padding:12px; }
    /* FLUSH mode: remove the gap entirely */
    .wrap.flush { padding: 0 !important; }

    /* Viewer: fixed height (360px), full width */
    .box { width:100%; height:360px; }
    .box > img { width:100%; height:100%; object-fit: contain; display:block; image-rendering:auto; }

    .tag {
      position:fixed; left:.5rem; bottom:.5rem; color:#ccc;
      font:12px/1.2 sans-serif; background:rgba(0,0,0,.45);
      padding:.25rem .4rem; border-radius:.3rem;
    }

    /* Controls */
    .controls {
      position: fixed; top:.5rem; right:.5rem; display:flex; gap:.4rem; align-items:center;
      font:12px/1.2 system-ui,Segoe UI,Roboto; color:#ddd; user-select:none;
      background:rgba(0,0,0,.45); padding:.3rem; border-radius:.35rem;
      backdrop-filter: blur(2px);
    }
    .controls button {
      border:1px solid rgba(255,255,255,.25);
      background:rgba(255,255,255,.08);
      color:#eee; padding:.25rem .5rem; border-radius:.3rem; cursor:pointer;
    }
    .controls button.active { border-color:#9ad; background:rgba(160,200,255,.18); }
    .controls label { display:flex; align-items:center; gap:.25rem; opacity:.9; }
    .sp { width:.4rem; }
  </style>
</head>
<body class="centerY">
  <div class="wrap flush">
    <div class="box"><img id="frame" alt="NOAA Aurora (24h animated)" /></div>
  </div>
  <div class="tag" id="stamp">loading…</div>

  <div class="controls">
    <button id="btn-south" type="button">SOUTH</button>
    <button id="btn-north" type="button">NORTH</button>
  </div>

  <script>
    // ---------- Tweakables (static) ----------
    const DEFAULT_HEMI = 'south'; // ← set 'south' or 'north' as the default on refresh
    let HOURS = 24;
    let STEP_MIN = 5;
    let JITTER_MIN = 4;
    let FPS = 5;
    let PRELOAD_AHEAD = 10;
    // ----------------------------------------

    // Hemisphere state
    let HEMI = DEFAULT_HEMI;
    let PREFIX = HEMI === 'south' ? 'aurora_S' : 'aurora_N';
    let BASE   = `https://services.swpc.noaa.gov/images/animations/ovation/${HEMI}/`;

    const pad2 = (n) => String(n).padStart(2,'0');
    const stampName = (d) =>
      `${PREFIX}_${d.getUTCFullYear()}-${pad2(d.getUTCMonth()+1)}-${pad2(d.getUTCDate())}_${pad2(d.getUTCHours())}${pad2(d.getUTCMinutes())}.jpg`;

    function buildGrid() {
      const now = new Date();
      const end = new Date(Date.UTC(
        now.getUTCFullYear(), now.getUTCMonth(), now.getUTCDate(),
        now.getUTCHours(), now.getUTCMinutes() - (now.getUTCMinutes() % STEP_MIN), 0, 0
      ));
      const start = new Date(end.getTime() - HOURS * 60 * 60 * 1000);
      const grid = [];
      for (let t = new Date(start); t <= end; t = new Date(t.getTime() + STEP_MIN*60*1000)) {
        grid.push(new Date(t));
      }
      return { grid, end };
    }

    const sweepOrder = [0,1,-1,2,-2,3,-3,4,-4];
    function candidateUrls(tBaseUtc) {
      const order = sweepOrder.filter(x => Math.abs(x) <= JITTER_MIN);
      return order.map(j => {
        const tj = new Date(tBaseUtc.getTime() + j*60*1000);
        return BASE + stampName(tj);
      });
    }

    let resolvedCache = new Map(); // key: ISO -> url|null
    function resolveFirstWorking(tUtc) {
      const key = tUtc.toISOString();
      if (resolvedCache.has(key)) return Promise.resolve(resolvedCache.get(key));

      const list = candidateUrls(tUtc);
      return new Promise((resolve) => {
        let i = 0;
        const tryNext = () => {
          if (i >= list.length) { resolvedCache.set(key, null); resolve(null); return; }
          const url = list[i++];
          const im = new Image();
          im.onload = () => { resolvedCache.set(key, url); resolve(url); };
          im.onerror = tryNext;
          im.decoding = 'async';
          im.src = url;
        };
        tryNext();
      });
    }

    const img = document.getElementById('frame');
    const tag = document.getElementById('stamp');
    const btnSouth = document.getElementById('btn-south');
    const btnNorth = document.getElementById('btn-north');

    let idx = 0, playing = false;
    const FRAME_MS = 1000 / FPS;
    let last = 0, acc = 0;

    let grid = [];
    let playlist = [];

    function setButtons() {
      btnSouth.classList.toggle('active', HEMI === 'south');
      btnNorth.classList.toggle('active', HEMI === 'north');
      document.title = `Aurora ${HEMI === 'south' ? 'South' : 'North'} – 24h (filename-only)`;
      img.alt = `NOAA Aurora ${HEMI === 'south' ? 'South' : 'North'} (24h animated)`;
    }

    function resetForHemi(newHemi) {
      HEMI = newHemi;
      PREFIX = HEMI === 'south' ? 'aurora_S' : 'aurora_N';
      BASE   = `https://services.swpc.noaa.gov/images/animations/ovation/${HEMI}/`;

      resolvedCache = new Map();
      const built = buildGrid();
      grid = built.grid;
      playlist = new Array(grid.length).fill(null);
      idx = 0;
      playing = false;
      tag.textContent = 'loading…';
      setButtons();
      warmFrom(0);
      firstPassResolve();
    }

    async function firstPassResolve() {
      let resolvedCount = 0;
      for (let i = 0; i < grid.length; i++) {
        const url = await resolveFirstWorking(grid[i]);
        if (url) { playlist[i] = { url, t: grid[i] }; resolvedCount++; }
        tag.textContent = `resolved ${resolvedCount}/${grid.length}`;
      }
      playing = true;
    }

    async function warmFrom(startIdx) {
      let warmed = 0, i = startIdx;
      while (warmed < PRELOAD_AHEAD && i < startIdx + (grid.length || 0)) {
        const p = playlist[i % (playlist.length || 1)];
        if (p && p.url) {
          const im = new Image(); im.decoding = 'async'; im.src = p.url;
          warmed++;
        }
        i++;
      }
    }

    function loop(ts) {
      if (!last) last = ts;
      const dt = ts - last; last = ts; acc += dt;

      if (acc >= FRAME_MS) {
        acc -= FRAME_MS;

        if (playlist.length) {
          let tries = 0;
          while (tries < playlist.length && (!playlist[idx] || !playlist[idx].url)) {
            idx = (idx + 1) % playlist.length; tries++;
          }
          if (playlist[idx] && playlist[idx].url) {
            img.src = playlist[idx].url;
            if (playing) {
              tag.textContent = playlist[idx].t.toISOString()
                .replace('T',' ').replace('.000Z',' UTC');
            }
            idx = (idx + 1) % playlist.length;
            if ((idx % 6) === 0) warmFrom(idx);
          }
        }
      }
      requestAnimationFrame(loop);
    }

    img.addEventListener('error', () => { idx = (idx + 1) % (playlist.length || 1); });

    btnSouth.addEventListener('click', () => resetForHemi('south'));
    btnNorth.addEventListener('click', () => resetForHemi('north'));

    resetForHemi(HEMI);
    requestAnimationFrame(loop);
  </script>
</body>
</html>
- Restart Home Assistant
Required so HA can serve new static files from/local/.
 Add the Card to Lovelace
Add an iframe card in your dashboard:
type: iframe
url: /local/aurora-map.html?v=1
aspect_ratio: 100%
If in Sections View
type: iframe
url: /local/aurora-map.html?v=1
aspect_ratio: 100%
grid_options:
  columns: 12
  rows: 7
 Cache Busting
- The
?v=1at the end forces browsers to reload when you update the file. - Each time you edit
aurora-map.html, bump the number (?v=2,?v=3, …) so you don’t get a stale cached version. - Once the card is loaded you do not have to restart home assistant to refresh, just bump the number.
 How It Works
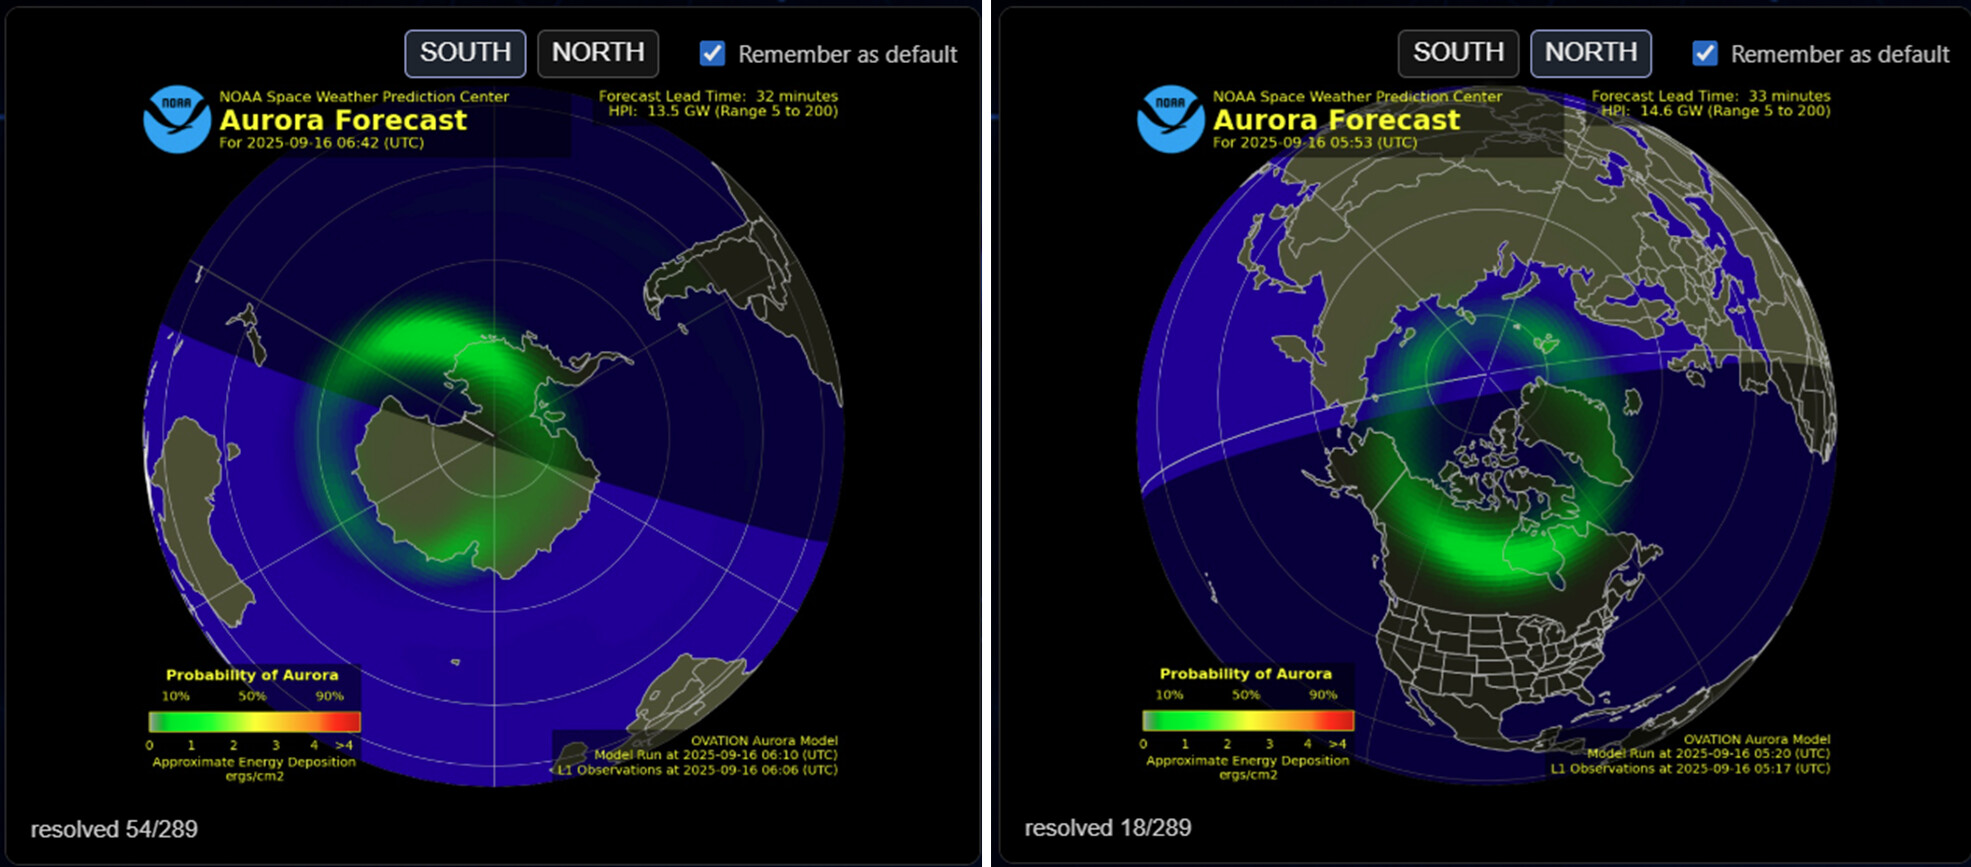
- Buttons: switch between SOUTH and NORTH.
* Remember as default: saves your choice in the browser (localStorage).- Buttons still override the active hemisphere for the current session (no persistence).
- Added a tweakable
DEFAULT_HEMI('south' | 'north'). - On load/refresh, the viewer uses
DEFAULT_HEMIand lights the matching button.
- Sizing:
- Width: responsive up to 960 px.
- Height: fixed at 360 px for consistency.
- No outer gaps (flush mode).
- Data source: pulls still images from NOAA every 5 minutes, resolving missing frames with a ±4-minute sweep.
- Playback: runs at 5 fps by default, preloading frames for smooth animation.
- Timestamp: bottom-left overlay shows UTC for each frame.
 Optional Tuning
Inside the <script> you can adjust:
// ---------- Tweakables (static) ----------
const DEFAULT_HEMI = 'south'; // ← set 'south' or 'north' as the default on refresh
let HOURS = 24;        // how many hours back
let STEP_MIN = 5;      // data cadence (minutes)
let JITTER_MIN = 4;    // search window for missing frames
let FPS = 5;           // playback speed
let PRELOAD_AHEAD = 10;// preload frames ahead
 Credits
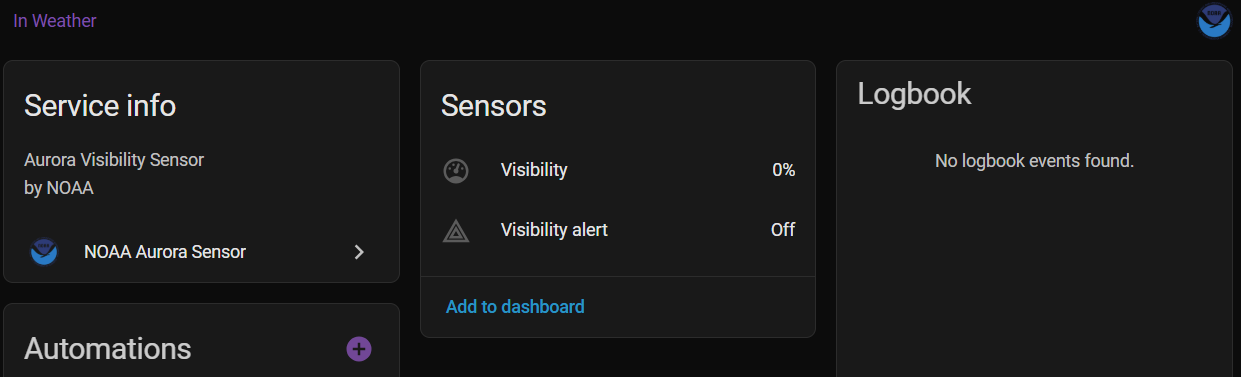
- Aurora images courtesy of NOAA SWPC OVATION model.
Data and service availability depend on NOAA’s infrastructure.