Hey,
Is it possible to create a visualization in HA that would show the average hourly energy usage over a specified period like one week, one month, 3 months etc? Similar in appearance to the by hour energy usage in the day view on the home assistant energy dashboard but averaging across the specified period. Heck ideally it would simply be the by hour view would remain when you changed to different time periods and simply average the values in the background.
2 Likes
I would love to see that also. Today my Electric company sent me a flier saying I could save ~$700 per year by moving to a rate plan and moving 10% of my usage out of the 4pm-8pm slot. My gut reaction is I don’t very much during that time slot - low 100’s of watts. An hourly average would prove or disprove my gut reaction.
1 Like
I am interested in this topic too. I would like to be able to estimate the potential for direct consumption of solar energy.
1 Like
In order to invest into a battery for solar energy, I would really need to know how much energy is used in average per hour over a longer period.
The initial request sounds exactly like that, does anybody have an idea how to solve it?
Tobu42
August 29, 2023, 12:05pm
5
I am facing a similar decision and would also like to access this data.
1 Like
Homezzz
September 2, 2023, 9:37am
6
Has this been solved somewhere else maybe?
So show 24 bars, 1 for each hour, and the value is the average power usage for that hour for the past X days.
1 Like
poolski
November 24, 2023, 10:40am
7
I wrote a Go CLI tool to do this for me. It queries the (hidden) WebSockets API that the Energy dashboard uses to get the per-hour totals for the last N days, then averages each hour block and gives you something like this:
powertracker -d 7 # 7 days' worth of data

+----------+----------+----------+----------+----------+----------+----------+----------+----------+----------+----------+----------+----------+----------+----------+----------+----------+----------+----------+----------+----------+----------+----------+----------+
|    0     |    1     |    2     |    3     |    4     |    5     |    6     |    7     |    8     |    9     |    10    |    11    |    12    |    13    |    14    |    15    |    16    |    17    |    18    |    19    |    20    |    21    |    22    |    23    |
+----------+----------+----------+----------+----------+----------+----------+----------+----------+----------+----------+----------+----------+----------+----------+----------+----------+----------+----------+----------+----------+----------+----------+----------+
| 0.300000 | 0.326000 | 0.333000 | 0.298000 | 0.397000 | 0.554000 | 0.408000 | 0.519000 | 0.552000 | 0.761000 | 0.591000 | 0.564000 | 0.880000 | 0.584000 | 0.636000 | 0.540000 | 1.204000 | 1.272000 | 1.011000 | 0.991000 | 0.386000 | 0.420000 | 0.277000 | 0.376000 |
| 0.374000 | 0.338000 | 0.352000 | 0.361000 | 0.386000 | 0.596000 | 0.499000 | 0.662000 | 0.837000 | 0.643000 | 0.819000 | 0.865000 | 0.680000 | 0.612000 | 0.570000 | 0.793000 | 1.350000 | 1.141000 | 1.179000 | 1.048000 | 0.621000 | 0.422000 | 0.277000 | 0.361000 |
| 0.368000 | 0.442000 | 0.338000 | 0.451000 | 0.349000 | 0.663000 | 1.645000 | 0.655000 | 0.672000 | 0.793000 | 0.577000 | 0.790000 | 0.820000 | 0.529000 | 0.682000 | 0.485000 | 1.827000 | 0.929000 | 0.779000 | 0.973000 | 0.606000 | 0.928000 | 0.338000 | 0.374000 |
| 0.354000 | 0.432000 | 0.390000 | 0.390000 | 0.613000 | 0.827000 | 0.973000 | 0.824000 | 0.438000 | 0.762000 | 0.936000 | 0.830000 | 0.943000 | 0.873000 | 0.749000 | 1.452000 | 1.215000 | 0.729000 | 0.813000 | 0.683000 | 0.529000 | 0.389000 | 0.419000 | 0.404000 |
| 0.370000 | 0.449000 | 0.358000 | 0.400000 | 0.402000 | 0.625000 | 0.567000 | 1.175000 | 1.106000 | 0.448000 | 0.391000 | 0.723000 | 0.604000 | 0.754000 | 0.713000 | 0.830000 | 1.267000 | 1.237000 | 0.865000 | 0.790000 | 0.652000 | 0.649000 | 0.420000 | 0.489000 |
| 0.399000 | 0.372000 | 0.340000 | 0.371000 | 0.373000 | 0.591000 | 0.409000 | 0.744000 | 0.475000 | 0.649000 | 0.433000 | 0.536000 | 0.494000 | 0.561000 | 0.568000 | 0.583000 | 0.519000 | 0.543000 | 0.577000 | 0.483000 | 0.459000 | 0.440000 | 0.432000 | 0.432000 |
| 0.306000 | 0.394000 | 0.344000 | 0.352000 | 0.414000 | 0.617000 | 0.611000 | 0.861000 | 0.897000 | 0.971000 | 0.734000 | 0.552000 | 0.781000 | 0.465000 | 0.553000 | 0.621000 | 0.853000 | 0.776000 | 0.948000 | 0.507000 | 0.864000 | 0.348000 | 0.435000 | 0.331000 |
+----------+----------+----------+----------+----------+----------+----------+----------+----------+----------+----------+----------+----------+----------+----------+----------+----------+----------+----------+----------+----------+----------+----------+----------+
| 0.353000 | 0.393286 | 0.350714 | 0.374714 | 0.419143 | 0.639000 | 0.730286 | 0.777143 | 0.711000 | 0.718143 | 0.640143 | 0.694286 | 0.743143 | 0.625429 | 0.638714 | 0.757714 | 1.176429 | 0.946714 | 0.881714 | 0.782143 | 0.588143 | 0.513714 | 0.371143 | 0.395286 |
+----------+----------+----------+----------+----------+----------+----------+----------+----------+----------+----------+----------+----------+----------+----------+----------+----------+----------+----------+----------+----------+----------+----------+----------+
2 Likes
tek
January 4, 2024, 9:43am
8
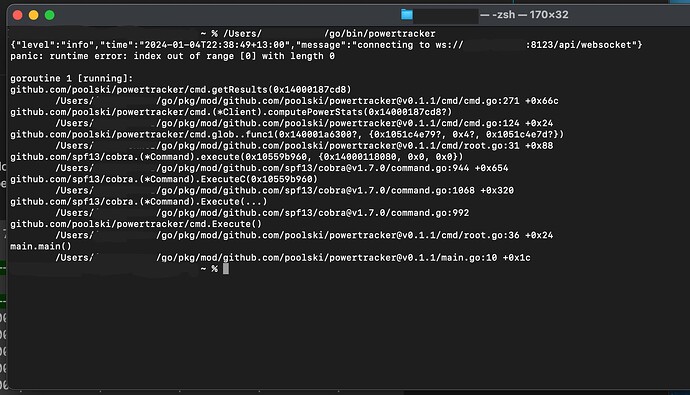
Hey @poolski , I have tried using this tool to export some of my energy data but I am getting a runtime error. This happens on my MacBook and a windows machine.
I’ve just realised something… I’ve based the code specifically on my sensor name.
Thanks for pointing this out - I’ll post a fix soon.
I have installed and configured the tool but I am getting this output…
ubuntu@hostname:~$ go/bin/powertracker -d 7
{"level":"info","time":"2024-02-20T18:45:36+01:00","message":"connecting to ws://localhost:8123/api/websocket"}
{"level":"info","time":"2024-02-20T18:45:36+01:00","message":"connected"}
{"level":"info","time":"2024-02-20T18:45:36+01:00","message":"authenticated"}
{"level":"error","time":"2024-02-20T18:45:36+01:00","message":"getting results: expected 24 sets of results, got 0"}
What am I doing wrong?
my config.yaml looks like this (had to change:‘sensor’ to ‘sensor_id’ as it first wrote ‘sensor’ whicih is not OK according to the docs…
api_key: VERY_LONG_STRINGasdfasjfajsndflakjsdflajsdfhlajksdfhasdf
sensor_id: sensor.power_consumption
url: 'http://localhost:8123'
I’ve also tried with sensor_id: sensor.energy_consumption_tarif_1 which is actually what is being recorded but to no success…
I think I’ve fixed it now
This is exactly what I’m looking for. I wish the API was turned into an integration.
also experiencing the same issue when using v0.1.2.
Hm no experience with “Go”. Could anybody briefly outline how to use this tool? Thanks!
