Bambu Lab X1 X1C MQTT

I have some free time this weekend, I think I’ll try to put in some functions for translations of certain values into your pybambu utils class file and put in a PR for stuff you’re currently missing.

That’s a weird bug, almost might suggest looking into a force-update interval for sensors when the mqtt is connected and all.

The Bento Box doesn’t do anything for noise except possibly add to it a little :slight_smile:

It’s a variation on the Nevermore recirculating air filter that is popular with Voron owners. When printing ABS or other filament that benefits from a higher, stable chamber temperature the recirculating filter keeps the warm air in, and the convection action helps (slightly) even out the chamber temp. You can hit 45c or so, and stay there, easily with it. Helps prevent warping and particularly for longer prints a higher stable chamber temp will add to ABS layer strength.

That’s only the secondary use for it though. It’s main purpose is to filter out VOC and gasses. It does a much better job than the X1C’s filter for a couple reasons: It’s multi-pass (i.e. it cleans the same air over and over) and as designed uses a first-stage HEPA filter to trap larger particles before the second-stage carbon pellets filter the rest.

Considering the X1C doesn’t even use the chamber fan/filter during ABS/etc. prints - because that would lower the chamber temp too much - this really helps clean things up. While the X1C by default will turn on the chamber fan full blast when an ABS/etc. print finishes, that is really not an optimal way to filter out gasses, etc. And you’ll get a lot of residue buildup inside the printer, particularly from ABS, that is a pain to clean and not great for your health.

Yeah it’s a lot simpler to tap the 24v power from the PSU. Just watch how much sustained draw you put on it. A couple fans, an ESP, and some LED lights won’t even pull an amp, which is well within the specs of the PSU, so just be mindful of what else you run off it.

I’d recommended putting a fuse inline on the main power tap with a quick fuse rated slightly higher than your expected draw - I have a 1amp fuse on mine.

This is exactly what can be done - I’m doing it :slight_smile:

In ESPHome I imported the “stage” entity from Home Assistant, the one your Flow provides in fact. Then just look for the “Printing” stage, which is only used for the actual print, not calibration. To turn the relay off look for the “Idle” stage.

I run my filter fans and LEDs off the same relay because both really only need to be on when actually printing.

Edit: I’m working on a full write-up on Github but in the short term if you are familiar with Home Assistant & ESPHome here’s the what the relevant bit of YAML looks like for all this:

text_sensor:
  - platform: homeassistant
    id: x1c_state
    entity_id: sensor.x1c_gt_x1c_stage
    on_value:
      then:
        - if:
            condition:
              lambda: 'return id(x1c_state).state == "Printing";'
            then:
              - switch.turn_on: relay1
        - if:
            condition:
              lambda: 'return id(x1c_state).state == "Idle";'
            then:
              - switch.turn_off: relay1

switch:
  - platform: gpio
    name: "BentoBox Fan Power"
    id: relay1
    pin: GPIO4
2 Likes

Target the mobile apps is my suggestion. I am also pretending to be a printer to the AWS Hosted MQTT which helps. If you can get the auth tokens still, you can do this. I’m unsure of the state of things with this at the moment. Someone getting in a flap about things for poor reasons means we have less visibility into the activity on our own networks now (gee thanks).

I’ve asked if they can properly support proxies, via Github and a support ticket.

How did you get report from P1P about nozzle and bed temps?

Edit: Connected to P1P only if no topics specified.

It’s my understanding that MQTT Explorer and the P1P don’t play nice for whatever reason, but if you connect with Node-Red and specify a topic, you can get the messages. I don’t have a P1P to play with, so I have no idea why and can’t dig in to it.

Question is: What topic we should listen to?

Should be the same as the X1C in this case: device/<your printer’s serial>/report

You can find the serial number in the app, slicer, etc.

Thought I’d share my dashboard and usecases for what I’ve done with extending the NR flow.

Node Red Flow Extensions


In addition to the published one in my gist, I extended it to FTP to the printer and get the 3mf file of the current print job. From this, it extracts both the print preview image, and the total net weight of filament used for the whole file.

I also have a DB schema setup that stores data for my printers and each print. Hooked up with a metering smart plug, I track the total kwh of the printer, and for each print the initial and later final kwh to calculate the amount used. This is multiplied by the electric rate at print time for the electric cost. It also takes in the amount of filament used, and if the print “FAILED”, it will multiply it by the final print progress %. This isn’t an exact measure but it’s better than nothing. It updates the print record on when running, paused, finished or failed.

Both of these keep using the HA integration palette nodes in NR, as it was the easiest way to get current states and detect state changes. I also have to rely on it 100% for some other printers, such as my MonoX resin printer, since I’m using a semi-broken component in HA for it, and nodered doesn’t have a palette for UART-WiFi.

Grafana Dashboard

The data entered into the DB is then used for my Grafana dashboard. First I have a list of all prints and some useful/calculated metrics. Printer name (selectable above, I also have other printers in here such as a resin printer), print start time, file/print name, duration (if in progress, then duration between start time and now), status (FINISH=Success, FAILED=Failed, RUNNING=In Progress, PAUSED=Paused), Kwh of the print (calculated column of final - initial kwh, but if in progress then current kwh - initial kwh), Electric cost is a generated column of electric rate * kwh of print, and if in progress it uses same calc as kwh, and finally Material used which as I mentioned, is the grams of filament for the print, and if failed, multiplied by progress - which is not always perfect but good enough. Previous prints have 0 grams because I didn’t add that until later.

Additionally, I have a column for print type (filament, resin). This also acts as a config column, which sets the unit of the material used column. Grams if filament, ML if resin.

I hope to expand this further by finding a way to match filament/resin types and costs which I’d need to store and likely manually enter for each, as it would span multiple printers and printer types.

Middle row are just electric costs of the selected printer. First is the total cost of idle time + prints, then there’s the cost of all prints combined in the time period, and finally the idle time costs. Idle time seems high because it’s since I installed the metering smart plug, and had run several prints before storing them in this db.

I have a table with one row each per printer for their lifetime kwh, and just update that for the total/idle costs calculations, which means it doesn’t work well with the timerange in grafana. I find it fine since I don’t care too much for finding my “idle costs” in a given timespan, moreso the “print costs” per timespan which does still work. Saves me from a bunch of db writes.

Final barchart is just the table, displayed as a barchart. I have another below it setup horizontally. That’s just for fun but I prefer the table myself, especially when the amount of records increases.

DB Table for prints for those interested. I have some columns I’m not using yet, but are placeholders for if I use them. Additionally, some columns I have in grafana are calculated in their queries (such as material units) or are from other tables related to my printers, but this is the most important one. It isn’t perfect but works for me!

CREATE TABLE IF NOT EXISTS prints (
    id SERIAL,
    start_epoch numeric PRIMARY KEY,
    printer varchar(25) NOT NULL,
    printer_serial varchar(20) NOT NULL,
    name varchar(75) NOT NULL,
    start_time timestamp DEFAULT (now() at time zone 'utc'),
    end_time timestamp,
    initial_kwh numeric DEFAULT 0.0,
    final_kwh numeric DEFAULT 0.0,
    kwh numeric GENERATED ALWAYS AS
  		(
        case WHEN final_kwh = 0.0 THEN 0.0
            ELSE final_kwh - initial_kwh
            end
      ) STORED,
    status varchar(10),
    electric_rate numeric NOT NULL,
    electric_cost numeric GENERATED ALWAYS AS ( 
        case WHEN final_kwh = 0.0 THEN 0.0
            ELSE ((electric_rate / 100) * (final_kwh - initial_kwh))
            end
      ) STORED,
    material_used numeric default 0.0,
    material_type varchar(10) default 'filament',
    material_price numeric default 0.0,
    material_cost numeric GENERATED ALWAYS AS (
        material_used * (material_price / 1000)
    ) STORED,
    material_description varchar(50)
);
HomeAssistant Dashboard

And finally, the HA dashboard. It’s pretty much the same as it was last time I shared it. Power, Speed and Light control. AMS preview (still need to put on temp/humidity icon badges on it just realized :laughing: ), print preview image inside the printer image, dynamic image and icon colour changing based on states, etc.

That’s 80% of everything I wanted out of it, but I can comfortably say that all my needs for monitoring and tracking my usage of the X1C are handled in HomeAssistant. Just need to make it easier to have a camera stream in here, better way to detect filaments (including if not via AMS), and some way to reverse engineer the bambu RFID system (or make my own replacement) then I’ll be (mostly) done :slight_smile:

2 Likes

Would definitely love an intergration

Thanks, worked.

How did you connect via MQTT Explorer to P1P? what user/pass?

Connected with no tls option enabled and deleted standard mqtt explorer topics and add only one mentioned above.

2 Likes

I am new to HA so this might be a newbie question.
I have a basic HAOS setup and everything works fine.
The only thing that is wrong is the fan speed.

Its JSON output shows:

"big_fan1_speed": "10",
"big_fan2_speed": "8",
"heatbreak_fan_speed": "15",

Which in reality correspond to: ( That 80% from the pic is me messing around trying to get the right value)

"big_fan1_speed": 70%,
"big_fan2_speed": 60%,
"heatbreak_fan_speed": 100%,

I am not sure how to convert that into the actual speed.
So 15 correspond to 100%, that is all I know haha
I have tried

{{ value_json.print.big_fan2_speed | int(base=16)*100/16 }}"

Which returns 50% but that is wrong

This is the whole template:

value_template: >
        {% if value_json.print is defined and value_json.print.big_fan2_speed is defined %}
          {{ value_json.print.big_fan2_speed }}"
        {% else %}
          {{ states(entity_id) }}
        {% endif %}

Thank you for any help.

Any chance you mind sharing those updates in your NR gist?

2 Likes

The numbers are directly tied to a percent and skips some in the 0-15 range, so the two methods are to either just map the numbers to their flat %, or to do a calculation with a ceiling, i.e.

percentage = (int(speed) / 15) * 100 // get percentage, speed is 0-15 from fan
return math.ceil( percentage / 10) * 10 // ceiling to map to actual percentage, always a multiple of 10

Not sure of the yaml template / jinga2 version of that, but hopefully that’s helpful!

Tossed them into the same gist as a second file, and left a comment for everything you need to setup! One thing to note is the FTP password can’t be set by the flow json, so that node-server-entity will need to be manually edited with the LAN only password. Also mentioned in the Rev 13/14 update comment.

1 Like

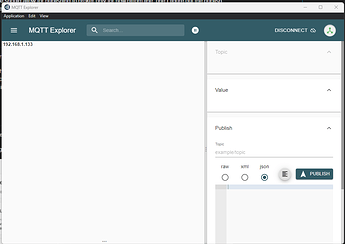
For those (like me) who are having trouble putting the pieces together enough to connect to their P1P via MQTT, here’s what worked for me, in the form of images:

Then click Advanced and remove the default topics, replacing with device/YOUR_SERIAL_HERE/report :

Then go back and connect, and you’ll see something like this:

It looks like certain status info can be scraped from strings if desired, such as these:

{
  "mc_print": {
    "param": "[BMC] Print percent:83.00%,0h34m left line=263739",
    "command": "push_info",
    "sequence_id": "80550"
  }
}
01/22/2023 6:14:41 PM 
{"mc_print":{"param":"[AMS][TASK]tray_exist:0x0;tray_read_done:0x0,vailed:0x0,reading:0x0","command":"push_info","sequence_id":"80575"}}
01/22/2023 6:14:41 PM(-0 seconds) 
{"mc_print":{"param":"[AMS][TASK]ams num:0,ams_exist:0x0,tray_now: 255","command":"push_info","sequence_id":"80574"}}
01/22/2023 6:14:41 PM(-0 seconds) 
{"mc_print":{"param":"[AMS][Period]:len=0.000m;buf=0.00;hall_e=20mV,cut=1547mV","command":"push_info","sequence_id":"80573"}}
01/22/2023 6:14:41 PM(-0 seconds) 
{"mc_print":{"param":"[AMS][Period]:bldc_i=0.00,u=0.00,spd=0.00;dw_spd=0.00;bdc_i=0.00,u=0.00,spd=0.00","command":"push_info","sequence_id":"80572"}}
3 Likes

I don’t have a P1P to test but these mc_print messages are pretty much the same as the X1C’s, but the difference is the X1C provides a bulk of information at once in the normal “print” message. Should still be able to scrape most of what you can from these miscellaneous messages, and whenever a value changes in the “print” too.

I wonder if the P1P can also receive commands as well - would be a good way to get some information. For example, if you send this payload to device/{SERIAL}/request:
{"payload": { "info": { "sequence_id": "20004", "command": "get_version" }, "user_id": "1234567890" }}
You should receive back a message giving the software + hardware versions and serial numbers of the various components (printer, some printer submodules, and any ams units). It will be {payload: info {}} and in info, the “command” will be “get_version”.