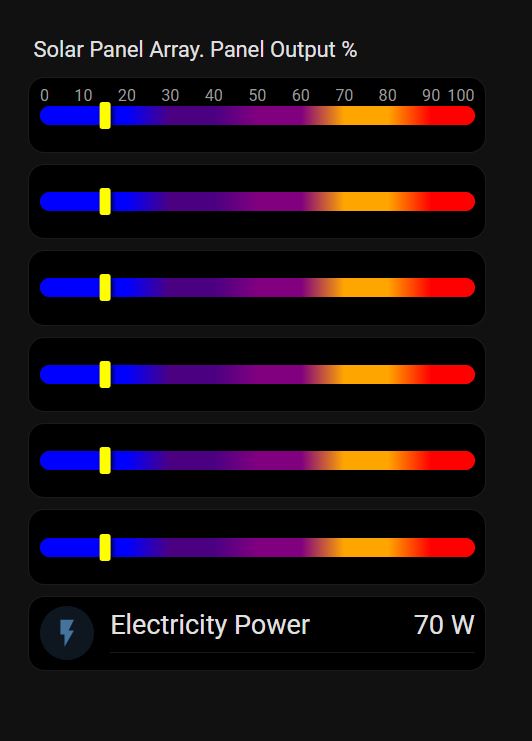
Surprised that there doesn’t seem to be anything included to do this.
My specific use case is I have two solar arrays, each panel has it’s own micro-inverter, and I can get energy output from each inverter. I’d like to be able to generate a bar graph with energy produced that day, for each micro-inverter with two separate graphs one for each array so the x-axis would be each inverter in the array and y would be kWh or Wh.
The bar chart would let me see if there are any malfunctioning panels/inverters since the outputs should be roughly the same for all panels in the array on any given day.
The device energy card seems to be pretty close to this(i’d rather have the x/y flipped but could live with it) except I can’t seem to find a way to make it show anything other than the loads that I’ve setup in the energy dashboard. Is there a way to use a selector to say select all the entities of this type in this location?
If there’s nothing built in I’d be fine adding a custom card, but even those seem oriented around time rather than entities.