I have been trying to make this work, but my card defaults to a 5minute view each time instead of 12 hour. My link is set up just like yours. Any ideas of what I should change?
Unfortunately it doesn’t work when I use a camera sensor. The direct link works perfectly. I also tried curl and a token. That doesn’t work for me either. The picture is broken. With the iFrame version I can integrate the charts. Grafana is stored in the docker of a Synology NAS. HA runs on an RPI.
camera:
- platform: generic
  name: Wetterdaten
  still_image_url: 'http://192.xxx.xxx.xx:8123/api/hassio_ingress/95-0MHs2hqeoXPw26fsnoM4RJv0KuNQv8Q42h3A8voI/d/0vffb8JMz/wetterdaten?orgId=1&refresh=1m&from=1608281918052&to=1608303518052&viewPanel=2'
  username: !secret grafana_user
  password: !secret grafana_password
How do I get the data about the camera sensor imported into Lovelace? Does anyone here have any ideas?
I got this to work but just wanted to warn others out there, I am running Grafana in docker, and the Grafana renderer in docker, and the renderer is using an insane amount of CPU usage, it appears to be a common issue. I just disabled this and opted to use iframes
See CPU usage below.

3 Likes
Amazing Guidance Thank You!
1 Like
Thank you very much for the great instructions 
1 Like
Have you been able to solve the need to start up Grafana to get the lovelace card to work? Anyone else got a solution?
As per @pacedev4 it is probably because Grafana uses OAuth, and when you first load up Home Assistant, it hasn’t kicked off the OAuth authentication yet, so there’s no active session open with the Lovelace iframe. When you navigate, it sets up a session, therefore you’re all set to go auth-wise when you navigate back to a lovelace iframe.
Seems like either something must be done to the authentication settings or some script must start a session. But not sure how to do it?
3 Likes
This worked perfectly!!!
for others &viewPanel=2&kiosk=1 changes the panel, this number can be found in the panel share button.
1 Like
Hey!
Please a little help with iframe. I have tried quite many things but without a success.
Here’s my embed code from Grafana
<iframe src="http://192.168.8.101:3000/d-solo/FYdO54CMz/outdoor?orgId=1&from=1622768856409&to=1622790456409&panelId=11" width="450" height="200" frameborder="0"></iframe>
Here’s my card conf
type: iframe
url: >-
  http://grafana:3000/d-solo/FYdO54CMz/outdoor?orgId=1&from=1622768856409&to=1622790456409&panelId=11
aspect_ratio: 100%
I’m running HA, Grafana, Influxdb2 in Docker and using docker-compose for it. Grafana service has a name grafana: in docker-compose file.
For some reason, HA card conf gets an error " grafana ’s server IP address could not be found."
If I go inside the HA container and check if HA container understands the grafana service and resolves it, it does
bash-5.0# wget http://grafana:3000/d-solo/FYdO54CMz/outdoor?orgId=1&from=1622768856409&to=1622790456409&panelId=11
[1] 270
[2] 271
[3] 272
bash-5.0# Connecting to grafana:3000 (172.18.0.4:3000)
saving to 'outdoor?orgId=1'
outdoor?orgId=1      100% |**********************************************************************************************************************************| 35390  0:00:00 ETA
'outdoor?orgId=1' saved
In docker-compose file, under Grafana service, I have also added env variable, to make Grafana “public”
    environment:
      - GF_AUTH_ANONYMOUS_ENABLED=true
What am I doing wrong?
I would look at apex charts card, there is a very good and easy method to get data from influxdb/grafana into the apex charts card which in my opinion looks nicer and is more configurable in lovelace.
I struggled with getting grafana graphs into my lovelace while using nabu casa for a long time, and eventually gave up. But now using the apex charts method I have a whole bunch of graphs using long range data loaded into influxdb.
Hi Ryan, can you share how you’ve got InfluxDB connected to the apex charts? Couldn’t find anything than creating sensors. Is there an easier way?
The steps above work pretty well. But, I’ve noticed that I am able to scroll within the card. Nothing else is in the card and it just scrolls a blank space?
For anyone using a pi with docker compose to install HA, grafana and influxdb.
I was trying to use the “embed” version of the grafana link, but it wasn’t displaying in HA, although it showed up in my browsers.
Found this link
And added the last two lines, already had anonymous enabled:
- GF_AUTH_ANONYMOUS_ENABLED=true #added
- GF_SECURITY_COOKIE_SAMESITE=none #added
- GF_SECURITY_ALLOW_EMBEDDING=true #added
Did a
docker-compose down
docker-compose up -d
And then the embed command works.
Process was to make a grafana dashboard with panel I wanted, click title of panel, then share, then embed. Uncheck current time range.
Copy the information in the square, but just the http part so it looks like this:
http://192.168.xxx.xxx:3000/d-solo/ijFfehCnk/temp_3d?orgId=1&panelId=4" width=“450” height=“200” frameborder=“0”
NOTE. Not a valid link, and used the entire thing, not just the blue part.
It also seems to work the same if you just use this part
http://192.168.xxx.xxx:3000/d-solo/ijFfehCnk/temp_3d?orgId=1&panelId=4
changing panelId at end to a different even number found my other panels
Then in lovelace editor, add a webpage and paste above into the URL section. A preview should show up after you paste the link.
That’s it, how I got grafana charts added to HA.
I have detailed instructions on how I installed and set stuff up here
Randy
3 Likes
Hi @randytsuch would you mind sharing your docker-compose file for Grafana and InfluxDB that you use on your Pi, I’m having a hard time figuring this part out.
@randytsuch thank you so much! You’re write-up was excellent!
Probably me, but I had an issue at the step where you login to Grafana for the first time with admin:admin. It would fail to set a new password and login, stranding me in the view-only mode. I eventually figured out that removing this line fixed the problem:
GF_AUTH_ANONYMOUS_ENABLED=true #added
Re-enabling that line after the password was set fine also.
u cant just use /api/hassio_ingress urls like that… once you restart the instance the connection will fail.
An additional entity-button brings me to the Grafana add-on to show me detailed charts.
Does the entity-button that you mention open the add-on directly in the same window/app or does it pop a new window / open the browser? I’ve tried using the URL action but that treats it like a completely external url and doesn’t just navigate to the add-on. Is there a trick that I’m missing?
For anyone that is using Nabu Casa and keeps getting the Grafana Navigation Panel popping up even with adding &refresh=10s&kiosk&fullscreen to the URL.
Follow the below instructions. You will still require to open the Grafana Addon for the graphs to display or change environment settings as per this post Best way to get Grafana chart into Lovelace card - #69 by randytsuch
1.Press the ^ symbol to Toggle top search bar.

Set auto refresh to 1m.
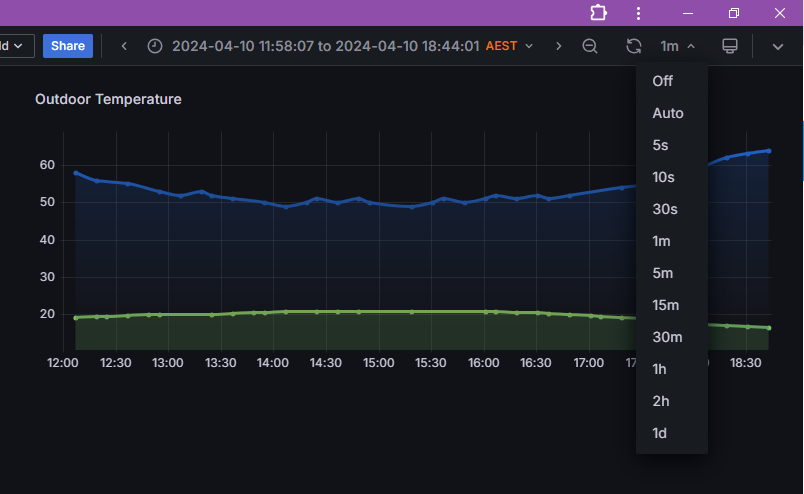
Click on the "Enable Kiosk Mode Symbol
![]()
Click on the three dot menu and click share.

Click on Embed, Ensure Current time range is off.
Copy the link

Add a webage card to your layout.
Paste the Embed link, NOTE the Embed link does not yet contain all the info you need.
(https://ifouiz3rfiho185v4nkjxadhyfhss651.ui.nabu.casa/api/hassio_ingress/JoJ6N-QxVWIT__wPPsRpe44yh9PFJmKNGt6INJPlrFo/d-solo/cdi8lyca5j8qoe/weather?orgId=1&refresh=1m&from=1712794718855&to=1712837918855&panelId=2)


The card will load up.
Enable Kiosk mode again within the card.

Click on the three dot menu within the card.
Click Share.

- This time you need to copy the Link URL.
- You may have to double click on the text and press Ctrl+A, Ctrl+C to copy the text.
- The Copy button may not work.
- This time you get a link with the data you need.
https://ifouiz3rfiho185v4nkjxadhyfhss651.ui.nabu.casa/api/hassio_ingress/JoJ6N-QxVWIT__wPPsRpe44yh9PFJmKNGt6INJPlrFo/d-solo/cdi8lyca5j8qoe/weather?orgId=1&refresh=1m&from=1712794718855&to=1712837918855&panelId=2
With the information you get after the ‘?’
- Leave orgld as default- orgId=1
- Refresh whatever refresh time you have set, in my case 1 minute - &refresh=1m
- From and to, change to the settings you have on you view panel my case now -12h to now. - &from=now-12h&to=now
- You can delete this field and the graph will default to browser time
Leave View Panel as Default - &panelId=2
- Ensure you add a “1” to the “kiosk=” - &kiosk=1

Paste the link into into the card via visual editor or yaml.
https://ifouiz3rfiho185v4nkjxadhyfhss651.ui.nabu.casa/api/hassio_ingress/JoJ6N-QxVWIT__wPPsRpe44yh9PFJmKNGt6INJPlrFo/d-solo/cdi8lyca5j8qoe/weather?orgId=1&refresh=1m&from=now-12h&to=now&panelId=2

          - type: iframe
            url: >-
              https://ifouiz3rfiho185v4nkjxadhyfhss651.ui.nabu.casa/api/hassio_ingress/JoJ6N-QxVWIT__wPPsRpe44yh9PFJmKNGt6INJPlrFo/d-solo/cdi8lyca5j8qoe/weather?orgId=1&refresh=1m&from=now-12h&to=now&panelId=2
            aspect_ratio: '16:9'
Click Save.
Your graph will appear as intended on the home page.
Logging into Grafana required. Unless you change environment settings Best way to get Grafana chart into Lovelace card - #69 by randytsuch

2 Likes
I used to have a kiosk mode of a Grafana chart perfectly showing a graph in Homeassistant. Then, upon one of the recent HA udpates, it started no longer being in fully kiosked (full screen) format, but suddenly the top menu of Grafana dashboard appeared back on the view. No matter what format of “kiosk” I use, I can’t seem to get rid of it again.
Any ideas?
I had the same problem with my webpage cards. All the address urls used to end like this:
?orgId=1&from=now-2d&to=now&kiosk=tv
I removed the “=tv” from the end and now the Grafana top menu is hidden again.