Hi, I’ll do my best to explain my issue.
A few days ago I switched to a dual tariff so I created a new utility meter with 2 tariffs (Peak, Offpeak), this has created 2 new utility meter entities “Grid Daily Peak” and “Grid Daily Offpeak” (and a select - but that’s not important now).
I then removed the old utility meter “Grid Daily” from the Energy Dashboard configuration in favor of the new ones (“Grid Daily Peak” and “Grid Daily Offpeak”).
The Peak tariff kicks in at 00:30 and stops at 04:30, I charged my batteries at roughly 2kW for 2h (starting from 02:30) so I’d expect about 4kWh of energy been used during that time and if you look at the statistic for “Grid Daily Peak” this is confirmed.

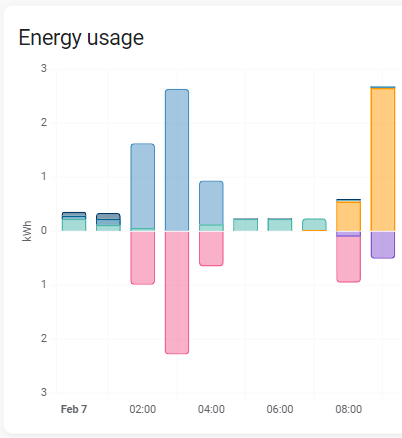
But I also noticed that the histogram was wrong:

Ene thought the correct amount of kWh was reported in the table below…

If I then switch back to “Grid Daily” (which is the simple utility meter with no spit tariff, the histogram returns to normal, showing the expected ~2kWh peaks at that time.
What could be that causes this?
Just so we are on the same page, I’ll leave you with some stats:

(“Grid Daily” and “Grid Daily Offpeak” basically overlap)

Also, worth mentioning that my automation that switches between the 2 tariffs seems to work perfectly.