Button-card problem css

Hello everybody.
Can someone help me solve this?
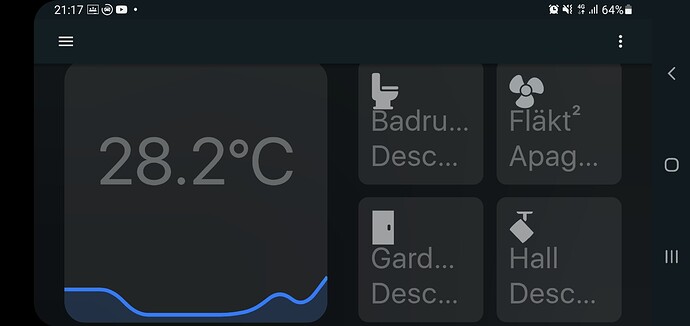
It wants to show a temperature and below a graph.
I want it to occupy 50% each block.
I have several problems.
1 - Temperature is not displayed complete
2 - The graph did not get to the bottom.
3 - The status and an icon that I think it hides appears at the bottom right.

Thank you

Card

      - type: grid
        title: Acuario
        view_layout:
          grid-area: studio
        columns: 1
        cards:

          - type: custom:swipe-card
            start_card: 1
            parameters:
              roundLengths: true
              effect: coverflow
              speed: 650
              spaceBetween: 20
              threshold: 7
              coverflowEffect:
                rotate: 80
                depth: 300
            cards:
              - type: vertical-stack
                cards:
                  - type: custom:button-card
                    entity: sensor.temperatura_plantado
                    name: Acuario
                    custom_fields:
                      graph:
                        card:
                          type: 'custom:mini-graph-card'
                          entities:
                            - sensor.temperatura_plantado
                          color_thresholds:
                            - color: '#007BFE'
                              value: 28.0
                            - color: '#26fe00'
                              value: 28.3
                            - color: '#FF5733'
                              value: 28.6
                            - color: '#fe0000'
                              value: 29
                          line_color: blue
                          line_width: 7
                          font_size: 10px
                          show:
                            name: false
                            icon: false
                            state: false
                    styles:
                      custom_fields:
                        graph:
                          [top: 60%,  left: 0%,  width: 100%, position: absolute]
                    template:
                      - temperatura
              - type: grid
                columns: 2
                cards:
                  - type: custom:button-card
                    entity: switch.sonoff_1000bed16f
                    name: Luz Acuario
                    template:
                      - base
                      - icon_hue

                  - type: custom:button-card
                    entity: switch.sonoff_10000a5f83
                    name: Luz Sump
                    template:
                      - base
                      - icon_hue

                  - type: custom:button-card
                    entity: switch.sonoff_1000447232
                    name: Balcon
                    template:
                      - base
                      - icon_hue

                  - type: custom:button-card
                    entity: sensor.temperatura_plantado
                    name: Acuario
                    style:
                      top: 20.35%
                      left: 41.31%
                      width: 10%
                    custom_fields:
                      graph:
                        card:
                          type: 'custom:mini-graph-card'
                          entities:
                            - sensor.temperatura_plantado
                          color_thresholds:
                            - color: '#007BFE'
                              value: 28.0
                            - color: '#26fe00'
                              value: 28.3
                            - color: '#FF5733'
                              value: 28.6
                            - color: '#fe0000'
                              value: 29
                          line_color: blue
                          line_width: 8
                          font_size: 75
                          show:
                            name: false
                            icon: false
                            state: false
                    styles:
                      custom_fields:
                        graph:
                          [top: 64%, left: 0%, width: 100%, position: absolute]
                    template:
                      - base
                      - temperatura

Template

temperatura:
    aspect_ratio: 1/1
    show_icon: true
    show_name: false
    show_state: true  
    styles:
      grid:
        - grid-template-areas: |
            "temp"
            "graph"        
        - grid-template-rows: 1fr 1fr
        - grid-template-columns: 1fr            
      custom_fields:
        temp:
          - align-self: stretch
          - justify-self: stretch
          - font-family: Sf Display
          - text-align: center 
          - justify-content: center;
          - font-size: 5em
          - position: absolute;
          - height: 50%;
          - width: 100%;          
        graph:
          - align-self: stretch
          - justify-self: stretch   
          - position: absolute;    
          - top: 50%;
          - height: 50%;
          - width: 100%;
          - font-size: 20px;
          - line-height: 20px;          
      card:
        - font-family: Sf Display
        - border-radius: var(--custom-button-card-border-radius)
        - -webkit-tap-highlight-color: rgba(0,0,0,0)
        - transition: none
        - padding: 10%
        - --mdc-ripple-color: >
            [[[
              return 'rgba(255, 255, 255, 0.3)';
            ]]]
        - color: >
            [[[
              return 'rgba(255, 255, 255, 0.3)';
            ]]]
        - background-color: >
            [[[
              return 'rgba(115, 115, 115, 0.2)';
            ]]]
    custom_fields:
      temp: >
        [[[
          return `<span>${entity.state}°C</span>`
        ]]]          

This is wrong syntax. If you’re not going to use yaml for these fields, you need to use proper json. What you posted is not valid json. It needs to be a list of dictionaries and all strings need to be wrapped in quotes.

You have “show icon: true” in your definition, so that icon is going to show up.
The situation with the temperature is what it does when it doesn’t think there’s enough room to display the whole text. You can vary the text size to fix that. It’s likely truncated due to the status and icon on the bottom right.
The padding at the bottom is part of the internal definition of the button cards. I’m not sure how you can change that.

You can adjust anything. Check out my templates, they do all sorts of things like this.

Thanks. I’ll take a look. I should realize by now that you never say “can’t” with HA. You might still be able to say that the investment of time and effort doesn’t net a large enough return, but that’s a far cry from “can’t.” :slight_smile:

1 Like

What’s wrong with this? Should it be in braces? {}

I think looking at this I realize that I only know the basics of css. 80% of what this is unknown. I’m going to look for each line of css to see what can be used in my code

I don’t know how to make a contour line. From what I see the drawing area goes right where the graph ends. If I can extend it it should look how I want

I show you how I look now. I had not realized that it was showing the icon and the status

Thank you very much for the help you are giving me


.
The problem is that when using the translator you do not understand 100% what it says.

You should just list it the way I listed it in my config. The json way is much harder if you don’t know json

Okay. Already did.
I can’t get the letter to be resonsive and the two blocks temp and graph occupy the entire card

I can’t get the font size to be responsive.

The font size is in .em