I created a fork of the excellent work by Jscruz (original author of integration) and Jfparis (dashboard and forecasting work) to show various data from Carbon Intensity UK (https://carbonintensity.org.uk/) which seems to be far more accurate than the source in Co2Signal. I’ve included sensors for current local carbon intensity, low carbon grid % and fossil fuel % and forecasted optimal usage windows.
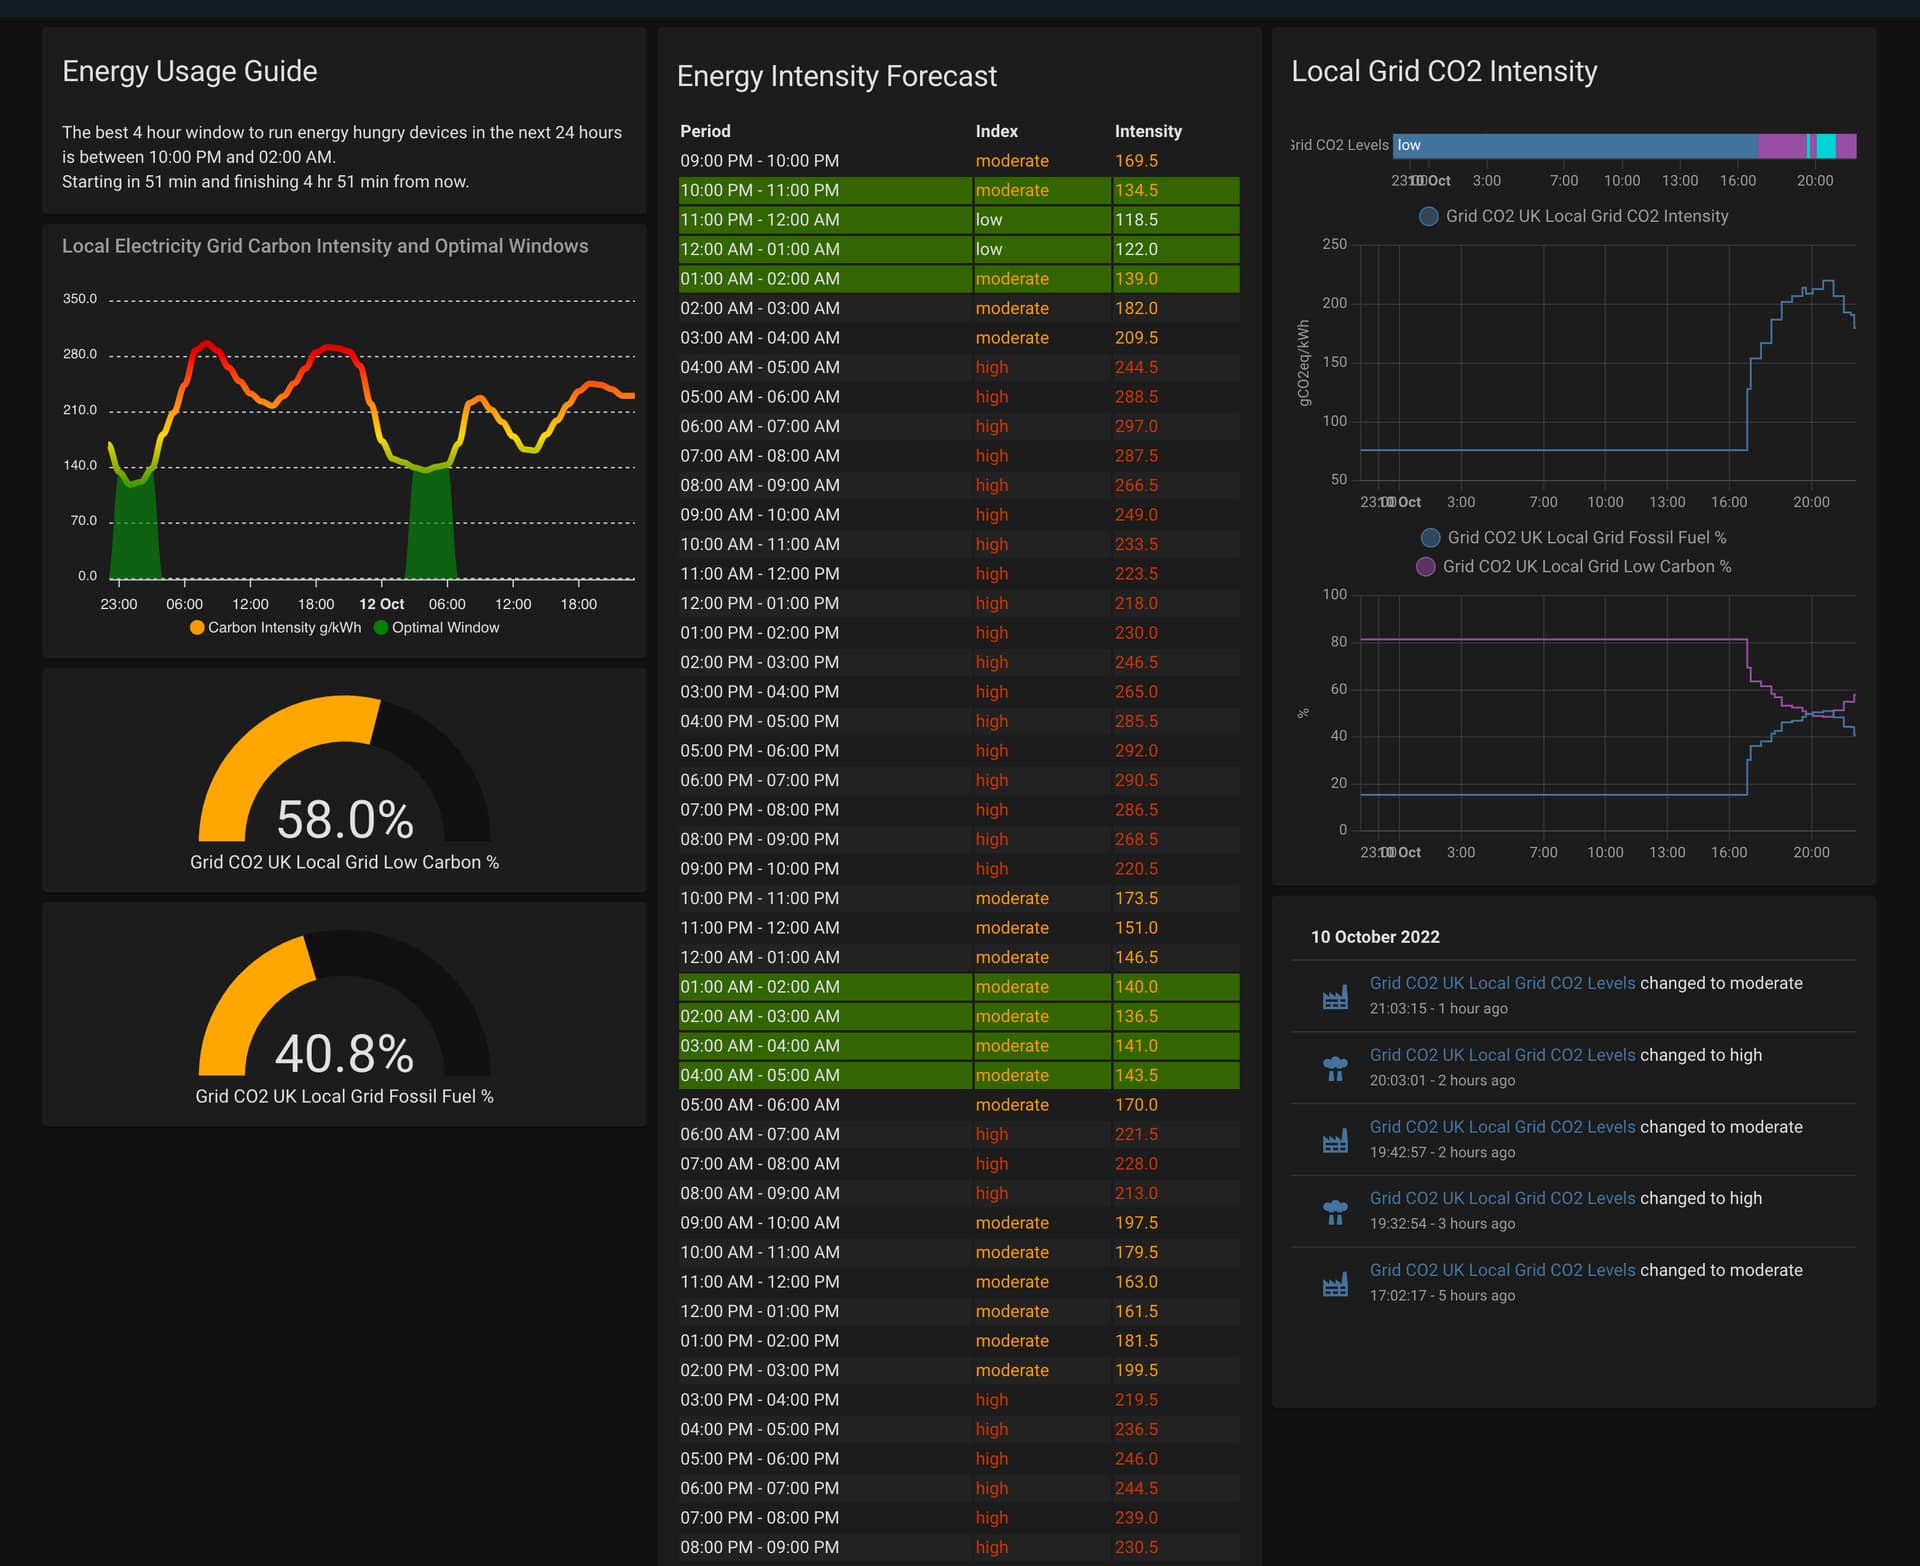
I’ve also done an updated dashboard that brings this together:
Cool. So this is purely for measuring CO2 intensity correct? When you say energy intensive devices you mean to not run them as to limit the output of greenhouse gas intensity (in this case carbon i suppose).
What do you use it for ? Any automations that you have tied to this ? Are you using it just to be as earth-conscious as possible ?
It’s purely measuring CO2 Intensity of the regional electrical grid yes, I’d like to use it for automations to switch devices on and off (charging my Fox ESS grid battery for example which is being fitted soon). I believe in the UK it’s a fairly good proxy for electricity pricing as well - generally emissions will be lowest when there is a lot of wind generation which can cause prices to plummet if you’re on a suitable tariff (Octopus Agile for example).
I’d also love to be able to integrate it into the standard energy flow diagrams but I believe these are stuck using CO2Signal for now - What triggered this for me (apart from it being an interesting bit of dev work!) was that I noticed the data from that didn’t seem very accurate and was making it look the house was using more high carbon energy than it should be doing.
Great, thanks, i’m taking a look for sure! I see in your repo page that translations is supposed to be a . hidden directory in HA, but in the repo it looks like a normal directory. Does it matter ?
Also - can i add your dashboard easily to a subview? I’m pasting your dashboard yaml into a subpage by using the manual option and pasting it in - but this code probably is for a whole new dashboard ?
I’ll take a look at the translations, I don’t believe it matters as I found an installation from fresh seemed to work fine but thanks for spotting it.
The home icon was just a bit of a hack for my own layout! Feel free to remove that and only copy the elements you’d like for the dashboard from the Yaml provided, it is as you say for a full dashboard but if you copy out individual components you should be able to add them to a subview (though this isn’t something I’ve tried yet).
Hi @atv, I’ve just taken a look now and I can’t find any instances of that error message however I have recently updated and logs might have been cleared so I’ll keep an eye out for it and if I see it try and update here/roll something out to address it.
Looks like it’s failing to get the forecast - Do you see any other issues? Alternatively it could be conflicting libraries if it’s still holding onto bits of the release version on HACS which doesn’t have the forecast object (not sure if you’ve had this installed before?).
sorry old thread - Im looking at something like this to try and predict next day prices on octopus tracker. there is an API call for 48 hour forward Co2 intensity but it returns 30 minute data and I have no idea how to format it ! any advice from people cleverer than me?
Hi, ive been using this ok for months but its now not working. when I attempt to add the integration with a post code it says ‘auth’ error and wont proceed. anyone else having this issue?
I recently upgraded to HAOS 11 so I guess it might be an issue with the new OS version.
Got this working, and just wanted to say great work, much more accurate than CO2 signal, and a lot more features! Is there a way I can use this for the Grid carbon footprint section of the Energy Dashboard?
This works great, but for some reason, will display the apex charts graph for 48 hrs then never seems to update beyond the first 48 hr unless I restart home assistant. Am I missing something??