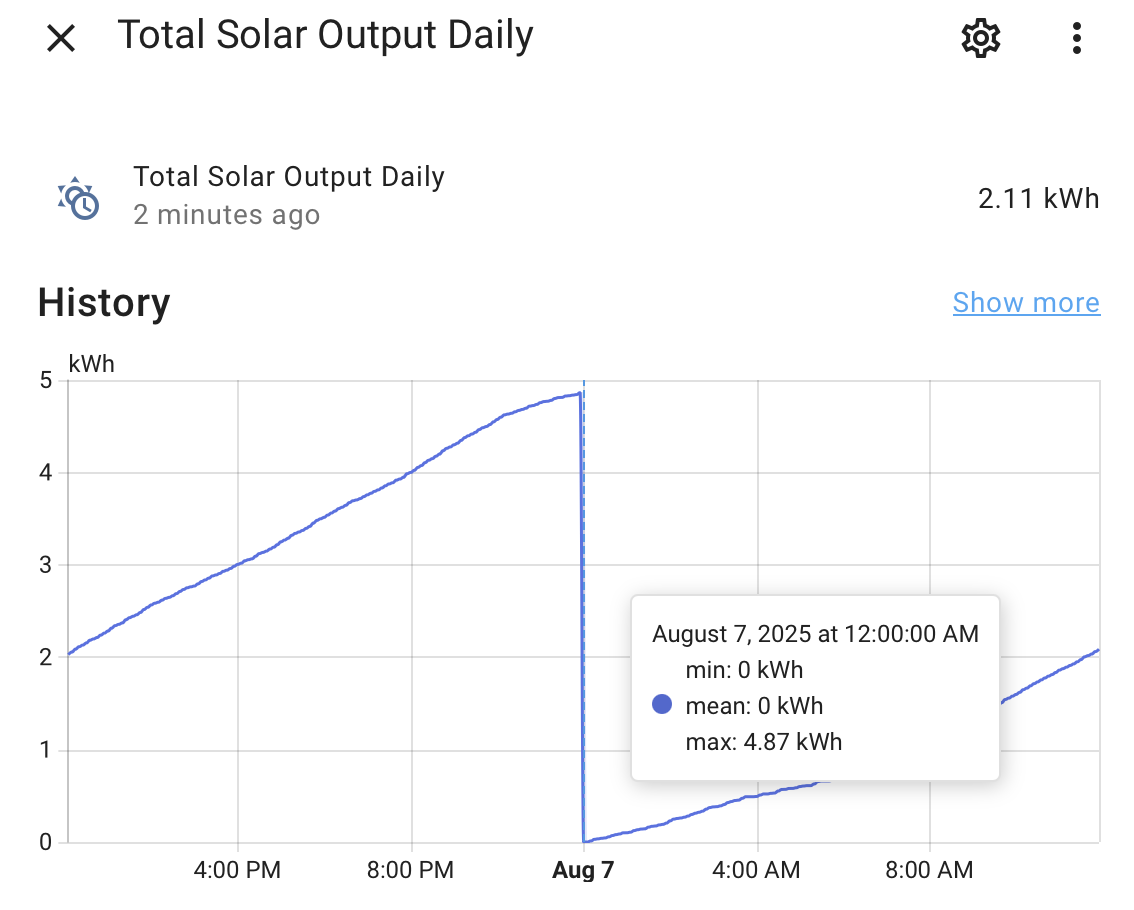
On HA 2025.7.4… I’m using the Combine the state of several sensors to combine the state of other template sensors ie utility that are all set to reset at the end of the day. I’ve verified that the component sensors are all resetting to 0 at midnight as expected but the Combine the state of several sensor min and mean are both showing 0 at midnight, but max is not. It takes till the next poll interval to show max was reset to 0. This kinda feels like a race condition type of issue or maybe I’m doing something a bit off.
the component sensors are template sensors that are subtracting the values of 2 utility sensors that are set to reset daily and do.
The max value not resetting as expected is causing my graphs to display incorrect daily data. Not to be pedantic, but if the mean is 0, shouldn’t the max also be 0?
i used the template helper, i assumed i would see it show up in my configuration.yaml or template.yaml, but its defo not there. I’m not really sure where to check as i didn’t write any yaml to make this happen.
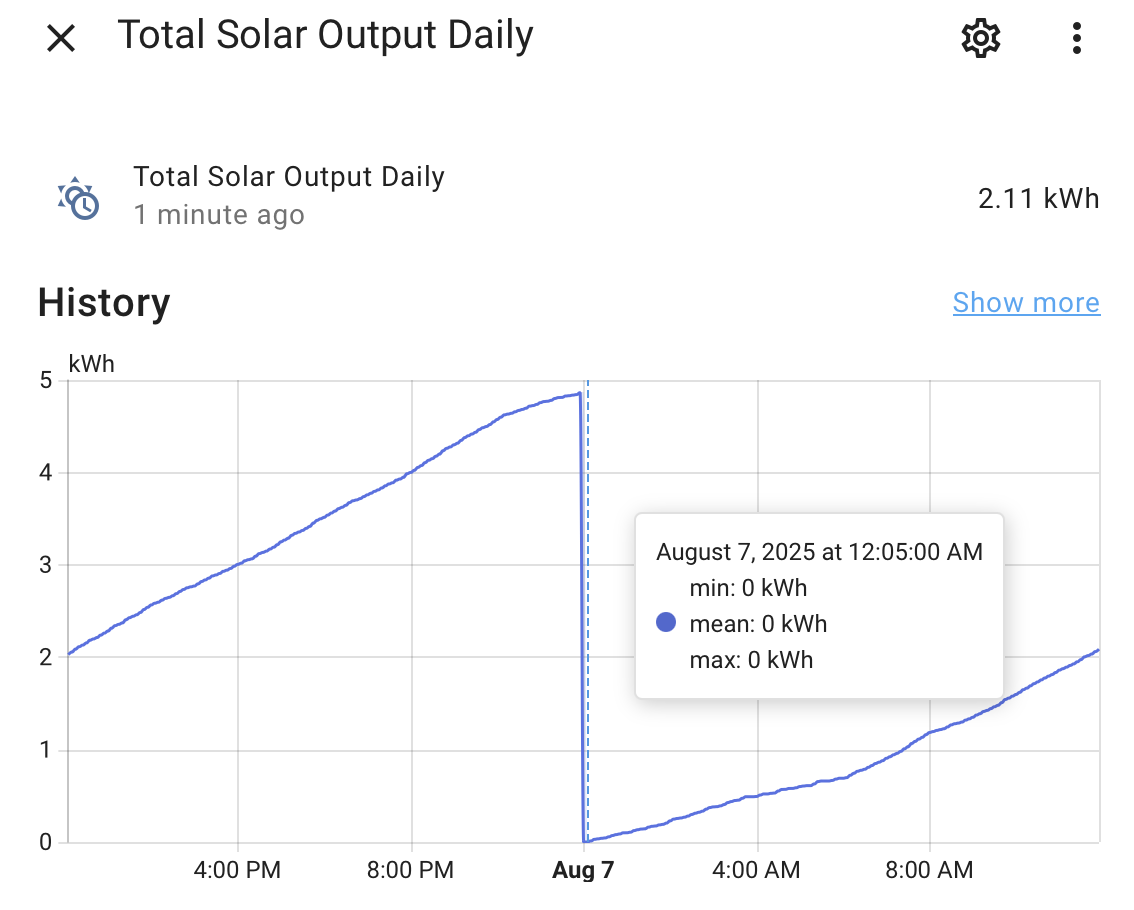
The mean is the time-weighted average over the 5-minute period. So if the value is 4.87 for 1 second and then 0 for the remaining 299 seconds, the average would be 0.016 and the max would be 4.87. In your case the value probably changed a few milliseconds after midnight instead of a full second. If that is the case, the statistics are working as they should.
You may have multiple issues here, but at least one of them is that your sensor needs a state_class set to total (instead of measurement) so that you don’t even generate min/mean/max statistics. Instead you should be seeing state/sum statistics once you fix the state_class issue.
Template sensors and utility meters are the only entities available to create through the UI where you can choose your state_class during creation. If you need to change state_class for another type of sensor you’ll have to use customize in YAML to do that.
This really sounded promising, I went back to double check everything and I’m not seeing where in a utility meter to set a state_class in the UI… new or preexisting. I checked the docs as well and I don’t see it there either.
As for the template sensors there were all already set to total, I double checked all of them just to be sure I didn’t miss anything.
IDK if this might help but…
I’m taking 2 watt sensors, input and output converting them both into kwh with separate Integral sensors, those Integral sensors are then feed into separate utility meters that reset daily so I have the daily totals for both. I feed both input and output utility meters into template sensor output - input in kWh, device_class = Energy, state_class= Total to get the input vs output total for the day.
Rinse and repeat for 4 more devices, The Total Solar Output Daily screenshot is the sum of those 5 differences which then feeds a daily and monthly statics graph. The 5 templates that make up the Combine the state of several sensors options only show state values, no min/mean/max. The Combine the state of several sensors helper is the only entity that shows min/mean/max in the entire chain.
Checking the state_class did lead me to this… I’ll have to try out the group sensor and see if the graphs look as expected with it.
For a utility meter you don’t explicitly set state_class but you get to choose between total or total_increasing depending on whether you enable “Net metering” (on=total and off=total_increasing).
What I should have said instead is that templates and utility meters are the only helpers available in the UI where it is possible to end up with a state_class that is set to either of those two values. Sorry for the confusion.
If you want to stay in the UI then I recommend deleting your “combine the state” helper and creating a template helper that performs the combining instead, and then you can explicitly set the state_class to total. {{ ['sensor.1', 'sensor.2', 'sensor.3', 'sensor.4', 'sensor.5'] | map('states') | map('float') | sum }}
You can also (if you’re running 2025.8.0) set an availability template: {{ ['sensor.1', 'sensor.2', 'sensor.3', 'sensor.4', 'sensor.5'] | reject('has_value') | list | count == 0 }}
But as I mentioned before, this might not be the only issue you have. Subtracting one utility meter from another leads to two issues, both caused by the two sources getting updated at different times (even if it’s only a few milliseconds deferent):
You can end up with a result that ratchets up instead of steadily increases. If your equation is a-b and b gets a new value, the template is re-rendered and the new result is smaller than the old result. The solution is either to use total instead of total_increasing (which you already confirmed you did) or to create a trigger-based template sensor that is triggered only by sensor a and therefore will always be increasing.
At midnight, depending on which sensor is reset to zero first, you can end up with a large negative value which persists only for a few milliseconds until the other meter resets. The solution here is to either live with it, or to change to a trigger-based template sensor as recommended above. If you elect to live with it, you just need to ensure you aren’t feeding this value into any utility meters (which you aren’t).
I replaced the “combine the state” with a group helper and the daily graphs work as expected now. Thank you for getting me here. Monthly does not, but I think that is because of how I chained the sensors/helpers together and is expected.
I was considering feeding the group helper to a utility meter that resets monthly and using total_increasing so it doesn’t drop to 0, but with your feedback I’m not sure that will work anymore.
Unless there is a better way (using the UI) I think I need to create a separate monthly chain of helpers to feed the monthly graph. Integral sensors → monthly utility meters → monthly template sensor → monthly group helper → monthly chart.
Just seams like a lot and this is extra, but maybe I’m asking for a lot
I would recommend setting everything up without any resetting. Everything should continually count upwards.
If you want to see hourly/daily/weekly/monthly/yearly changes, you can do that with a statistics graph card referencing your never-resetting entities. That is how the entire energy dashboard works. You can choose what period and what interval you want to see data for, and the frontend calculates it all using the statistics data. The state of the utility meters (and therefore the detail about when they reset) is totally irrelevant.
Edit: for clarity, you can leave everything as daily-resetting, and viewing hourly/daily/weekly/etc with the statistics graph card will still work.