Hi there,
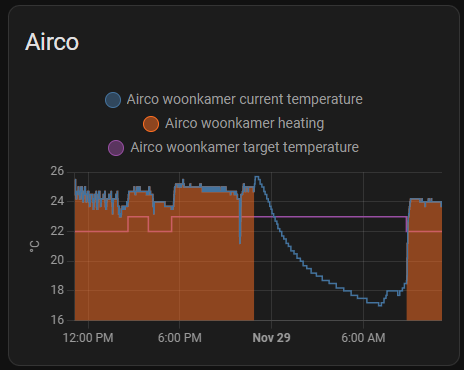
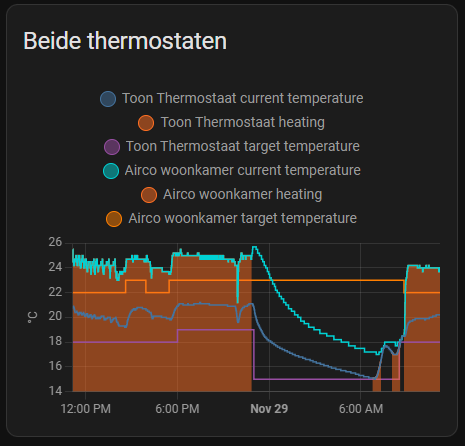
Having 2 heatsources, Central heating and Airconditioning, I like to see how they work together. So I combined graphs:


into:

This works for me but I am not happy with the format.
The legend could use some upgrade and the graph colors too.
Any suggestions?
Hans