Compact card to display multiple air quality readings from multiple air quality sensors

I am looking for a compact card that could show 5 different air quality readings from 9 different sensors. I am using Qingping Air Monitor Lite, each reading is a separate entity in this format :
sensor.air_monitor_lite_[sensor_name]_[temperature/humidity/carbon_dioxide/pm25/pm10]

First I tried custom:multiple-entity-row, but this not strictily a table/column display so ‘columns’ are not aligned:

Then I found custom:flex-table-card, which seems much more powerful (including entity by regex) and nice (css formatting), however if I understand correctly I would need my sensors to expose individual readings as entity attributes instead of separate entities, that way I could use ‘data’ as selector. From what I read, currently there is no way to combine those readings so I have Temp/Humidity/Co2 etc. as separate columns and each sensor in separate row.

I did not manage to find any other cards/plugins that would solve my problem. Would be grateful for any tips.

PS. I only just started with HA, I’m C++ programmer and have no idea about .js and web programming, and hope I do not need to dig too deep. Table/grid display of different entities seems like a basic functionality so maybe I missed some obvious way of doing this.

Welcome!

Yes, I think your need goes the opposite way that most folks do. Getting entities from attributes is most folks need. That said, have a look at the solutions by the smart folks in this thread on the ‘Template’ sensor function of HA. And below that is an example of using the flex-table-card, that I use. But I think you are already in the know on how to use this card.

A good ‘grid’ element has been something I’ve chased for a long while. Good hunting!

    # https://github.com/thomasloven/lovelace-auto-entities
    # https://github.com/custom-cards/flex-table-card

    - type: custom:auto-entities
      filter:
        include:
          - entity_id: /sensor.international_space_station_iss_pass_*/
        exclude:
          - state: unknown
          - state: 'unknown'
          - state: Unknown
      card:
        type: custom:flex-table-card
        title: ISS
        columns:
          - name: Date
            data: pass_start
          - name: Quality
            data: quality
          - name: Length
            data: state
          - name: From
            data: start_compass
          - name: To
            data: end_compass
          - name: Max Elevation
            data: max_elevation

1 Like

I managed to create a single entity from multiple by using legacy template format, and now all works fine with flex-table-card.

Unfortunately, I think it’s impossible to make it so clicking on a cell shows a graph for specific attribute (e.g. humidity), which previously worked when using custom:multiple-entity-row in my original post. I can only click on a row to get a graph from new templated entity (so for temperature, as it is used as value_template, see below).

Example of templated ‘aggregate’ sensor in configuration.yaml:

sensor:
  - platform: template
    sensors:
      air_monitor_lite_c452_template:
        friendly_name: "Living Room"
        value_template: "{{ states('sensor.air_monitor_lite_c452_temperature') }}"
        attribute_templates:
          carbon_dioxide: "{{ states('sensor.air_monitor_lite_c452_carbon_dioxide') }}"
          humidity: "{{ states('sensor.air_monitor_lite_c452_humidity') }}"
          pm25: "{{ states('sensor.air_monitor_lite_c452_pm25') }}"
          pm10: "{{ states('sensor.air_monitor_lite_c452_pm10') }}"

lovelace card:

type: custom:flex-table-card
title: Air Monitors
clickable: true
entities:
  include:
    - sensor.air_monitor_lite_*_template
strict: false
columns:
  - attr: friendly_name
    icon: mdi:city
  - data: state
    icon: mdi:thermometer
    suffix: °C
    align: right
  - data: humidity
    icon: mdi:water-percent
    suffix: '%'
    align: right
  - data: carbon_dioxide
    icon: mdi:molecule-co2
    suffix: ppm
    align: right
  - data: pm25
    icon: mdi:molecule
    suffix: µg/m³
    align: right
  - data: pm10
    icon: mdi:molecule
    suffix: µg/m³
    align: right
css:
  table+: 'border: 20px solid white; border-collapse: collapse;'
  thead+: 'font-size: x-large; color: #44739e'
  td+: 'height: 28px;'
  tbody tr:nth-child(even): 'background-color: #F5F5F5; '

2 Likes

Nice! clean, simple and readable. Yes, I too hit a wall with the ‘clicking on an element’ function in these ‘table like’ structures, my javascript abilities are far too meager. Hopefully a smart folk can chime in with some ideas.

Interested to hear what you learn from your reading over time. I have found the CO2 number from my AraNET4 devices to be interesting and relatable to human activities around the houses. I’ve not has much relatable events around the ppm air quality measures in a while (good thing I think, no fire/smoke in my part of the globe).

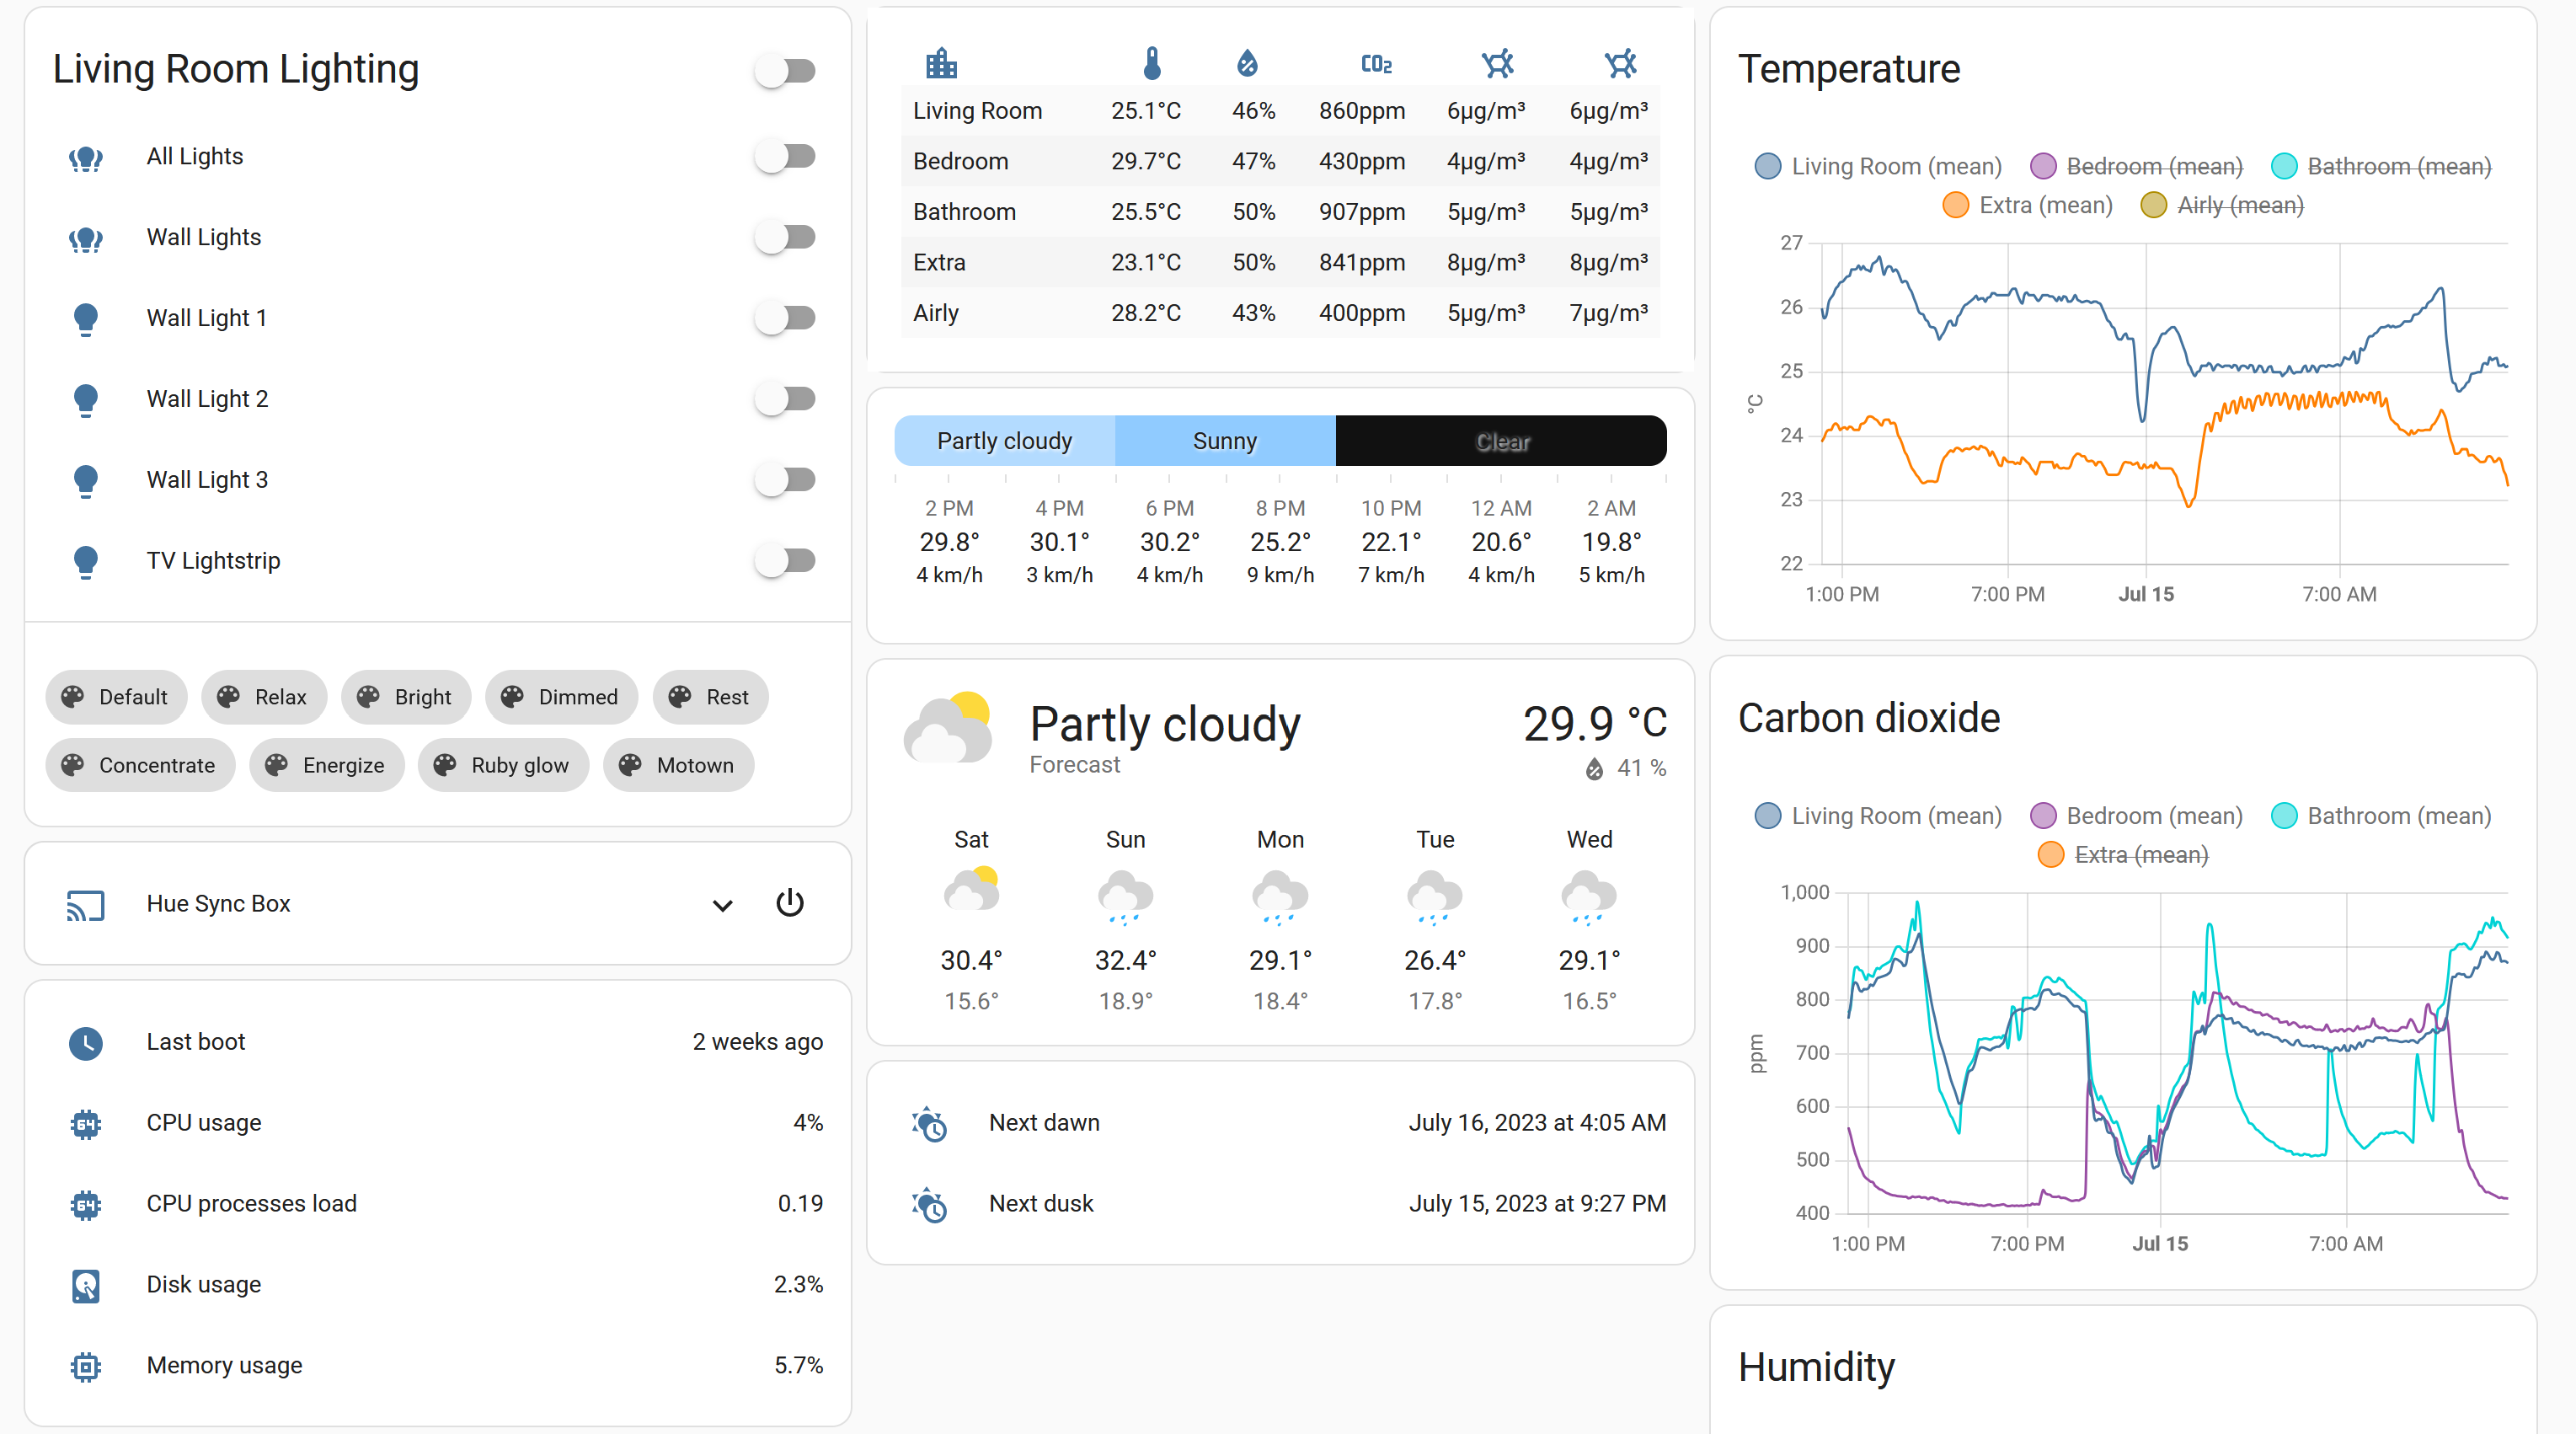
Still didn’t figure out how to get the original graphs on-click, but I opted for using defualt statistics graph card for each of the readings to have all CO2 for all rooms in the same graph. If I want to view single reading in isolation I can just filter out other readins by clicking on the legend. I just wish I could remove “(mean)” and choose custom colors to make the graph more compact. Tried GitHub - kalkih/mini-graph-card: Minimalistic graph card for Home Assistant Lovelace UI but it didn’t have “filter readings option” and was generally annoying to use with mouse, so I’m sticking to default card.

Interested to hear what you learn from your reading over time. I have found the CO2 number from my AraNET4 devices to be interesting and relatable to human activities around the houses.

I’ve been using a single sensor for couple months, and that’s been my observation. E.g. at my office workstation it usually is around 600-700ppm, but when I was showing something to my 3 coworkers over the course of an hour, it went up to 1200ppm. It is also very easy to track with graphs how long it takes to ventilate your apartment.

I’ve not has much relatable events around the ppm air quality measures in a while (good thing I think, no fire/smoke in my part of the globe).

I live in Krakow, which is one of the most poluted cities in the planet during winter due to people burning coal (and even trash) to heat their homes in surrounding counties (Krakow itself has laws against it, but counties do not, and Krakow is unfortunately in the valley). BUT I bought the first sensor only after the winter has ended, so the measurements have been usually between 5-10 pm2.5/pm10 which is nicely below max acceptable norms. We’ll see next winter.

I was actually interested in finding some window/balcony door automation that I could program to open the windows automatically around 1pm, when the polution is lowest during the winter (but I’m usually at work). Alternatively, this could be also useful for automatically closing all windows during sunrise to maximize ventilation and avoid letting in hot air. Unfortunately, I wasn’t able to find anything in Poland other than factory/buissness-center oriented stuff that’s not very pretty, requires extra wiring, and not even guaranteed to work with windows in my apartment because of the size.

Here is a cute pet-project of random youtube person that I found to give you an idea https://www.youtube.com/watch?v=m_tzf79y90Q

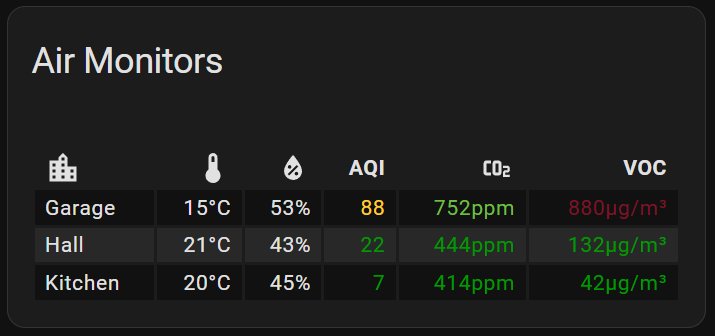
Tangentially related: from what I read about air quality sensor, they all use the same 2-3 integrated circuits that you can buy for couple bucks, so when buying something more consumer-grade you pay for form-factor and software. I ended up with Qingping Air Monitor Lite due to compact shape, HA integration, and Xiaomi app, but it was relatively expensive. You can calibrate CO2 sensor by resetting it through the app and putting the sensor outside, but not the other readings.

After buying 9 of those I can tell that each of them can give you significantly different reading in the same location, so I wouldn’t recommend them for absolute measurements, but it’s accurate enough to
get useful information from graphs over time (e.g. how much time is needed to ventilate a room, or in the temperature graph on my first screenshot you can see the difference in temperature between two ends of a room - one near window on south side that’s always scorching hot during the day, one on the other side near AC unit - i specifically choose sensor that had similar temperature readings to avoid bias).