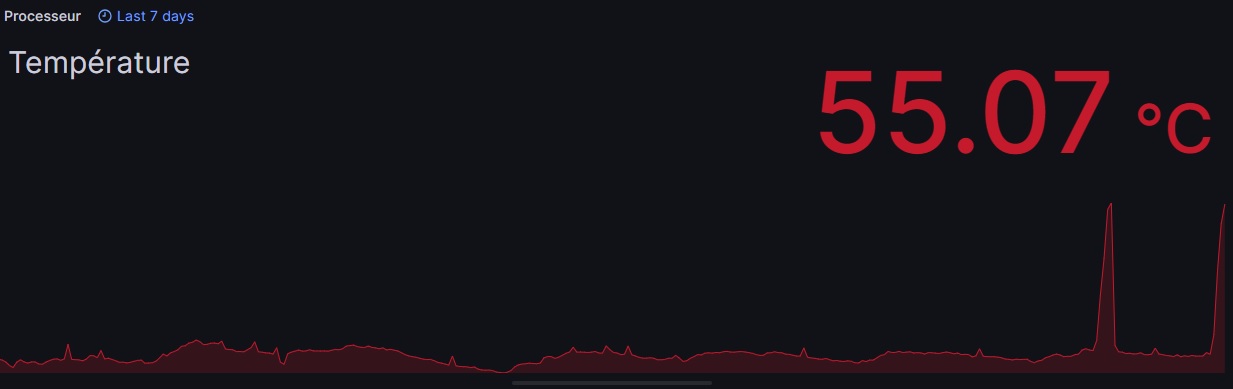
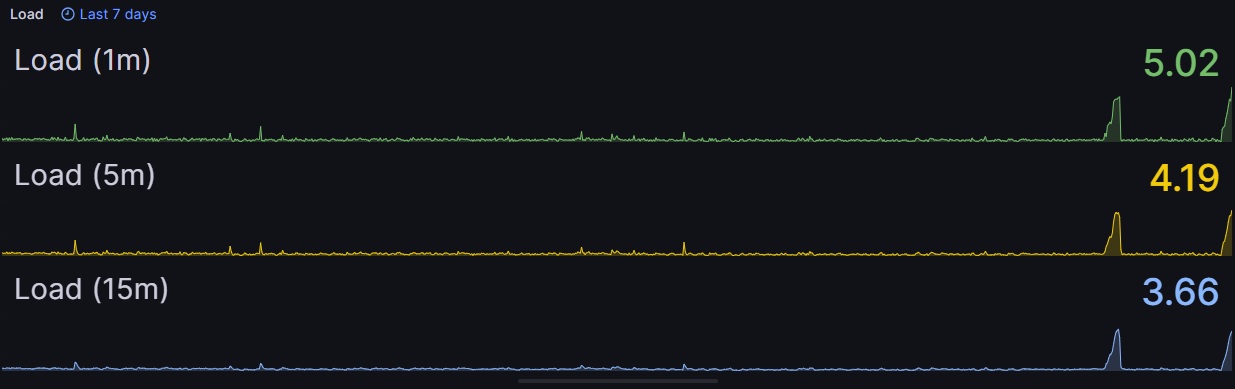
Since yesterday, I’m facing strange behavior from my HA. I’m running my HA on a Raspberry Pi 4, and in average the CPU usage is about 3%. But since yesterday, for a reason I don’t know, After hours of normal activity I see the my CPU usage jumps to 75%.
In parallel I see the memory usage that increases a lot, from 15-20% in average, to something like 50%. I can also see the load increases quite a lot. (all the figures are extracted from the System Monitor sensor - System Monitor - Home Assistant).
How can I find the root cause of that issue ? I’m quite new on HA and still need to learn more on how to monitor my HA.
For the moment, the only solution I found was to force a reboot of my raspberry Pi. I was then OK for several hours, but now the same problem occurs again.
Yesterday, I noticed that since few days the System Monitor sensor was having issues, I cannot anymore monitor the eth0. But I did nothing, I changed nothing in my configuration, and there is no new device, new automation, …
Well, no, to be fully honnest, I made very small changes. I renamed some entities (iPhone/iPad), to make things a little bit more clear, but I don’t think it can causes that kind of issue …
Yes, I’m up-to-date with eh OS and with all the add-ons that I’m using. I see that recently the following add-ons were upgraded:
grafana, to version 9.1.0 (4 days ago)
influxdb, to version 4.8.0 (4 days ago)
vscode (Studio code server), to version 5.12.1 (done yesterday, could be the origin of my problem ?)
It’s a pitty, I’ve estarted by HA 10 minutes ago, to avoid my raspberry overheating. Now I see that the CPU usage of Studio Code server is very low, but it was maybe higher before the restart. To be monitored anyway
Thanks for the tip, it is indeed what I’ll have to do next time it happens. My feeling is that vscode is the root cause, but to be confirmed of course.
I’ve some automations and scripts, but no loop so far.
Thanks anyway for your help, I’ll keep you informed of my findings
I can confirm it is an issue with VSCODE. My CPU usage was back to normal after a reboot. Idem for the memory usage and the load.
You need to know that VSCODE is flagged to be started on boot. And when I was checking its CPU usage, it was very low (close to 0%).
But as soon as I open the Studio Code Server UI, I see the CPU usage increases a lot, and going back to the add-on screen, I see VSCODE uses up to 48% of the CPU, and then stabilizes at 25-30%.
It uses also more and more RAM, passing form 0.1% to 10% (and continuously increasing).
I checked all my other add-ons, the CPU usage is always very low, close to 0%.
Release 5.12.1 of VSCODE was issued yesterday, but I think we will have a patch soon