Hi
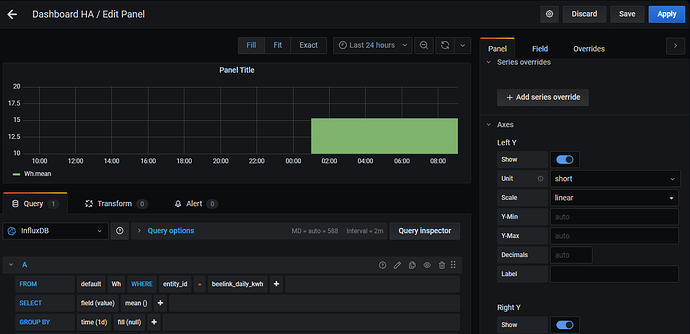
I have a sensor that is modified at 23:59:00 every day to get the daily consumption of a smart plug and I would like to have a Grafana bar graph to show daily bars
I am a begginer in Grafana, so what I have achieved is this graph, but I would like to get, in the time axis, a single day and not hours.
What should I do to get it?
Thanks
