I have an issue yesterday where I had a wildly wrong reading taken into the energy dashboard. In 1 of the hours there it seems that my grid export was 24,856.042kWh for that particular hour. This has thrown all my stats out for any time period that covers that.
I have looked at the data from the underlying meter collected by another tool, and it all looks good there, so I can’t explain how HA Energy dashboard stuffed up the reading. But from the numbers, I can see kind of what must have happened.
For background, I am using a Iammeter energy meter via a Modbus sensor in HA which normally seems to work very well. The energy dashboard gets its grid reading from the Export Total for this meter (ie kWh total since the meter was installed). At the time this incorrect reading occured, the all time cumulative value for this meter was about 24806kWh and counting. Error was in the 16:00-17:00 time block, so in truth very little power would have been being exported in this window. At the start of the day, it was 24755.585kWh and at the end of the day it was 24806.241. So in fact, the correct daily reading should have been about 50.7kWh. So I suspect the explanation is that somewhere in the hour HA somehow got the bad reading, and it added the total at the time of 24806kWh to the incremental 50.7kWh for reasons unknown. But maybe HA got a bad reading in there of zero or something, and then when the next correct reading came in the incremental value becomes the all time total instead of a real increment from the last good reading??
Anyway, is there any way I can check and correct the underlying data?
And as a second question, is it worth treating this as a bug to prevent the bad reading, or if that is not easy to do, place some logic and limits to be able to ignore the data that is out of any sensible ranges.
I am realitively new to HA and am not a programmer, so I hope help can be targeted at that level.
The reason is usually that the sensor changes large value → 0 → large value. So the energy dashboard sees that large step and adds it.
What your sensor should have done was go large value → unknown → large value. The energy dashboard does not add the massive step in that case.
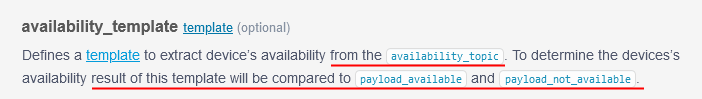
If the integration is causing this, log an issue. Or filter the value through a template sensor that rejects all readings less than <large_value> minus 10%, and has an availability template.
If the integration is using a value_template or template sensor, this needs adjustment to include an availability t template.
In the template above, I have used > 1 because I suspect I just need to filter out the zero based on what I have seen, and assume this will cause less issues if the meter ever needs to reset back to zero then we should all be good to go??? But I am only really guessing what this does, so your guideance on this would be apprecaited.
I have then used the entity in the Energy Dashboard in the return to grid field. But it looks like it only has history from when I created it. So it looks like I loose a lot of the energy history that I had built up. Is there a way of importing the history data, or editing the spike out of the other meter?
It is also true to say, I did not understand what you meant by ‘This filtered sensor is then used in a utility meter that is fed to the energy dashboard (as I want access to the daily total). But you could feed the filtered sensor directly to the energy dashboard.’ in your other post. So not sure if that is a clue I should be doing things a little differently to what I have done? I have implemented the meter with modbus TCP as per this configuration Solar-PV-Monitoring/Yaml in Home Assistant/ModbusTCP at master · lewei50/Solar-PV-Monitoring · GitHub. Should I be doing it differently?
The template sensor should filter out 0 values. As long as your source sensor dropped directly to zero it should prevent this occuring again. Look closely at the history of the last incident did it drop directly from 24806 to 0 or was there a point recorded in between?
If so you will have to make the availability template > that intermediate number.
No there is no way to import your old energy history.
You don’t need a utility meter. You can feed it directly to the energy dashboard.
Yes, the sensor dropped immediately to zero, so I assume that will work.
For other people, I stumbled across a way to “correct” the energy data based on the old sensor. Under Developer Tools there is a “Statistics” tab. If you find the affected sensor, on the far right of that row, there is a “Adjust Sum” icon. If you click on that, you can adjust out the bad “Sum” entry. Simply bring up the affected time period (look at the sensor history to find the wrong value) and set the number you want to set. This seems to have fixed the “Energy” dashboard totals for me, but not the historical value of the sensor which is less important for me from a historical prospective.
This does not fix the underlying problem, and I assume it is not unlikely I will see the same thing happen again which I will likely need to manually correct again. But I have setup the “filtered” sensor as outline by Tom. And at that point these will have more history of the corrected data and when I have enough historying, I can change the energy dashboard over to use these filtered sensors.
Hi: swainstm:
We have just checked this issue and found when the energy meter power up,in a very short time(around 1 second), the Modbus/TCP server is already on (Listen on the port of 502) but the measurement result is not ready.
If there is a Modbus/TCP request, it may reply the zero data.
This probability is very low ( power-up && the modbus request occur within that one second time) , but indeed exists
we have just fixed this issue and will release a version later
But we found another very strange problem.
Please see this pic .
we export the data in HA and found there are some random data(marked as “unavailable” in the exported csv ) displayed in the chart of the dashboard.
Does someone know this reason?
Why did HA plot the “unavailable” point (with a specific value) in the chart?
Is this some problem of HA?
I think there is a bit more to my problem than an issue on “power up”, because I have had this issue at other time beside the power up. I have been using Modbus for about a week or 2, and I have had to correct this issue at least 3 different times, and none of these are when the meter has powered up, and from my prospective, seems to be out of the blue with no other explanation. HOWEVER, I notice if I go to the meter local web interface, the “Runtime” is some number of minutes that is a LOT less than the time they were powered up. Eg, all my meters right not have “Runtime” of 588. That is less than 10 hours ago. I had a blackout 10 days ago and the meters should have been constantly up since then. So it appears the meters might be restarting themselves for other reasons??? Could this be when the invalid data is slipping in?
As for the other issue you are seeing, I have not seen that on my implementation unless I am missing something, So maybe it is something to do with your setup rather than the meters?
Sorry, my description is not accurate before, it is not “power up”, but a reboot.
There is an auto reboot logic in this firmware, the time is around 10 hours.
Anyway, we will provide a new FW version for this issue this week, thanks for your feedback.
2 When the energy meter reboots and has connected to the LAN successfully, it will take 1-2 seconds to prepare the valid data. If the first Modbus/TCP request is in within this 1-2 seconds, it will return zero data in the previous version.
Feature changes:
The auto-reboot cycle is extended to 24 hours (Before: 10 hours)
I have another data spike issue I would like to fix.
Background is I am using LocalTuya to read Energy (Wh) from an energy meter. I also have a “Utility Meter” Helper to break that down into Day, Week, Month and Year rather than a less relevant meter total.
Sometimes when I add a device or reconfigure something in Tuyalocal, or restart HA, it seems a lower value is sometimes (but not always) read. The main problem with this is that the Utility Meter helper seems to take notice of this lower value, and assume it is relevant, and the next read that is correct causes the Utility meter to jump by the difference between the lower spike and the correct value which is sometimes substantial.
So I thought I would create another “filter” sensor to try and fix this. The basic logic is if the new value is below the previous value, just update with the previous value. I don’t really have a good understanding of the yaml coding here, but I have cut and pasted snipets from other things that work. My code is below :
  - sensor:
      - name: "hiking5_local_energy_filtered2"
        icon: "mdi:counter"
        unit_of_measurement: "Wh"
        device_class: energy
        state_class: total_increasing
        state: >
          {% set old = states('sensor.hiking5_local_energy_filtered2') | float %}
          {% set new = states('sensor.hiking5_local_energy') | float %}
          {% if old < new %}  {{ new }}
          {% else %} {{ old }}
          {% endif %}
        availability: "{{ states('sensor.hiking5_local_energy')|float(0) > 1 }}"
This creates the Entity, but nothing ever appears in there?
Does anyone have ideals on how to fix this, or an alternate approach that filters out the corrupting entry that has the meter go backwards for 1 reading?
I have setup a input number, automation and template sensor which I hope will do the job. The sensor seems to work and update which is a good sign it might work. However, in truth, I have not been able to trigger the invalid value, so until that happens, the jury is out.
I followed the outline by _Brian in Apr 21. My template and automation is as outlined below :
I have occassionally noisy data with missing or absurd readings for single samples then normal operation continues. This can be because of interference, data corruption, power dips, bad sensors, software bugs, etc.
I use a 3 sample median statistics filter when needed to remove the single errors regardless of whether they are high or low. This will slightly delay your readings - in may case by 2 minutes - and completely eliminates the data spikes without any need for knowledge of the underlying system or what is an absurd value. I tend to use early this in the signal chain before further processing rather than at the end of the chain in multiple places.
For example I was trying to capture peak power demand of my house to properly size a battery system I plan on adding. The peak readings where confused by my EV charger which will eventually be separated. I was subtracting the EV charger demand from the grid import to get house demand, but skews between the separate sensor reading times would sometimes have the apparent house demand increase by the charger demand or sometimes be reduced into negative numbers when the charger turns off. The median filter eliminated this issue and my peak captures are now clean.
# House Power Filtered
# Median of 3 Samples
# Eliminates single sample spike caused by EV charger start/stop
- platform: statistics
  name: House Power - Filtered
  entity_id: sensor.house_power
  state_characteristic: median
  sampling_size: 3
The ID of the sensor you create is linked to the “name” used in the statistic definition. In your case (unless you have renamed the object) your sensor would be something like sensor.energy_meter_electric_consumption_filtered. I don’t know for sure how non-alpha characters are treated in all cases.
Go to developed tools/states and search for something with “filtered” in its name to see the actual ID created.
On the other hand I have not tried this with an energy sensor directly. I would try to go back further in the signal chain if possible to smooth before the values are integrated into energy.