After a few month and many sensors configured I started group them by functionality in custom dashboards.
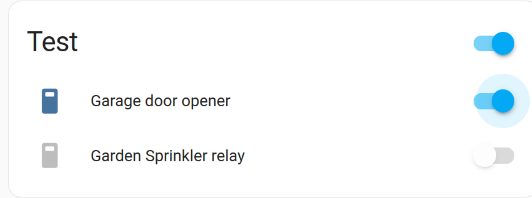
In the Default dashboard if I create a Device Area and multiple switches in it, The Area Name will have status that will show that if a switch is ON.
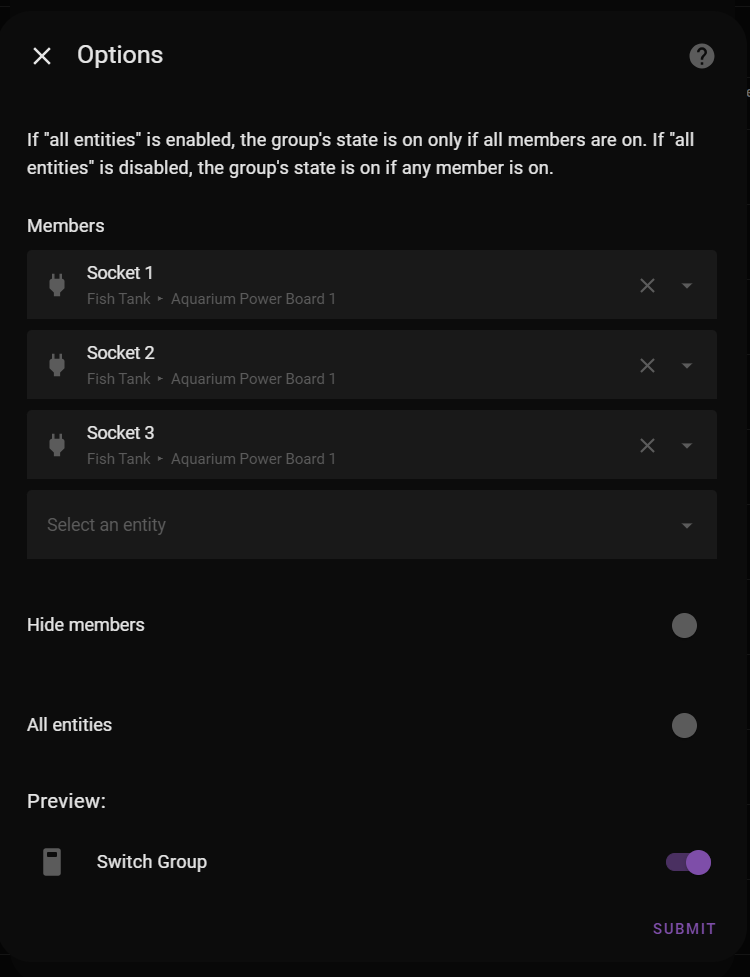
Like here in the Area Test show switch ON when one of the switches is ON.
And I can not figure out how to duplicate this functionality in a custom dashboard.
Lets say I have 6 leak detectors and want to send alert if any one of these is active. So instead of triggering automation on any of the 6 sensors I’d like to trigger on single entity like Area in Default dashboard.
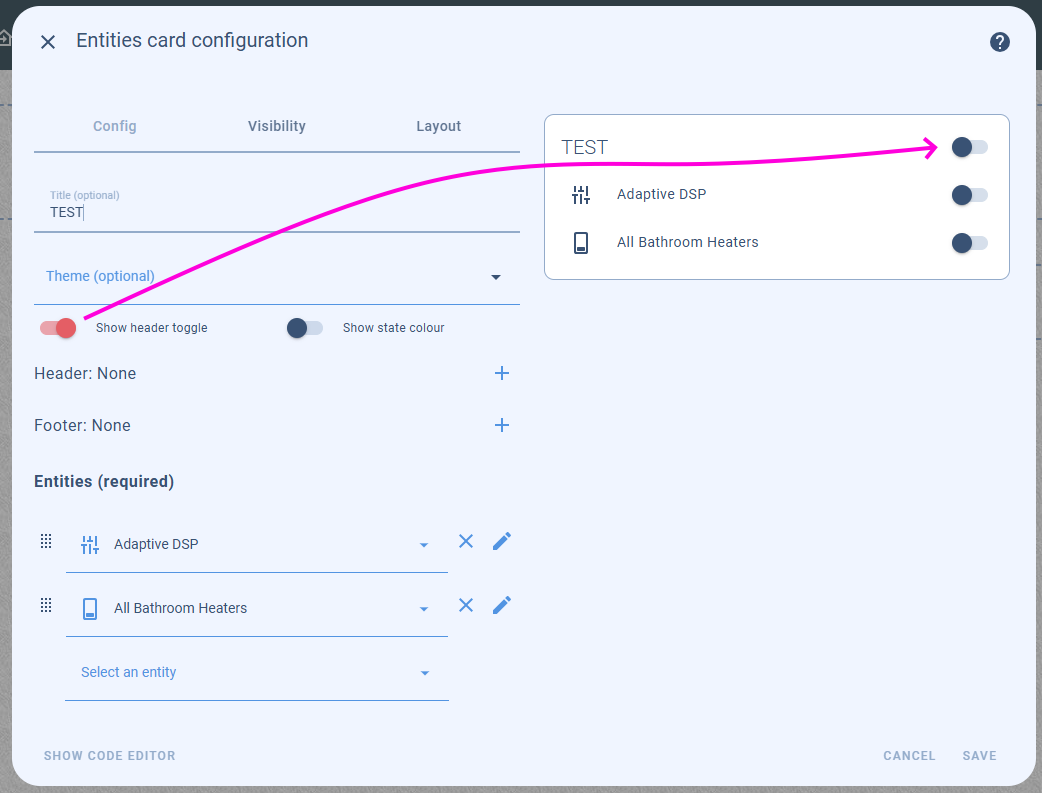
You probably don’t need to create a group to do this if you only want the control in the card. The entities card has this option that will control all switches in the card: