That’s expected behavior. Entities you add dynamically over the UI are stored in your browser. The same card can display different entities on different browsers, depending on where you add it. If you want to have your card show the exact same graphs on all browsers at any time, then you will have to specify them by hand in the YAML.
Gotcha. Makes sense. Thanks

upon updating…
forget about that, I installed in a backup!.. got to remember not saving those last opened folders…
all working nicely now:

one question (and I know history-explorer card should be able to know, because I FR this in the regular card too…): please check if it would be possible to Not show the history graph, when the entity is not in recorder?
The regular dropdown box only shows available entities. It would be awesome and reason to never even contemplate the core more info, if History-explorer card would filter out those here too!
Good to know it works.
Well yeah, that’s planned. I wrote this override thing in a couple of hours, so it’s far from being a finished and polished feature yet ![]()
1 Like
and yet it already looks so beautiful! as if it has always been like that. magic. thx a lot, and, as always, happy to test run what you throw at us
1 really important thing though: the graph now interpolates, instead of showing absolute state changes?

extremely zoomed in to reveal minute view:

Yeah, it uses lines mode for the graph (linear interpolation between state samples) and it skips invalid / unknown states and interpolates over them. States themselves are not affected though, if you hover over them they are the raw values from the DB. It’s only the lines connecting them.
Those are the default settings of the history explorer card. I’m still looking for the best way to make this configurable in the same way you can currently configure the custom card (colors, interpolation modes, min max, etc). I haven’t really found a good way yet. Frontend config is always tied to an actual custom card in HA, I can’t find a nice way to supply config YAML to something that’s neither an integration nor an actual card.
I might end up storing the config in the local browser cache or something.
Maybe the way Browser-mod does it? Seems to also store in local cache, and has a configuration tab in the side bar
Browser mod is a full blown integration that also installs a custom server side component. I’m not going to do that. But I’m going to figure something out. Maybe a separate info panel config card or an option in the HE card that copies the config YAML into the browser cache.
Edit: OK, found a pretty elegant solution to the config problem. 1.0.32 will be on HACS soon, probably tomorrow after work when I find an hour, with fully user configurable info panel popups.
2 Likes
Hallo Alex, and thanks for the history explorer card indeed,
is there PLZ some way to customize a bit the layout (bar distances, hide supplementary axes, etc.) in history bar graphs for non numeric entities?
I mean something like reducing the graph card to minimal size to fit to small area, (I sent some comment to other post - here: Support for binary sensor history graph · Issue #109 · RomRider/apexcharts-card · GitHub )
if there is any option I will be glad to know it.
thanks indeed.
W.
Enclosed the pics from the linked thread…
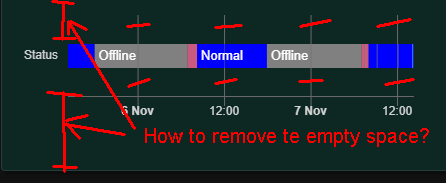
for more entities it could be better to put them closer together and get more space… and also maybe a lower (thinner) bar a bit?
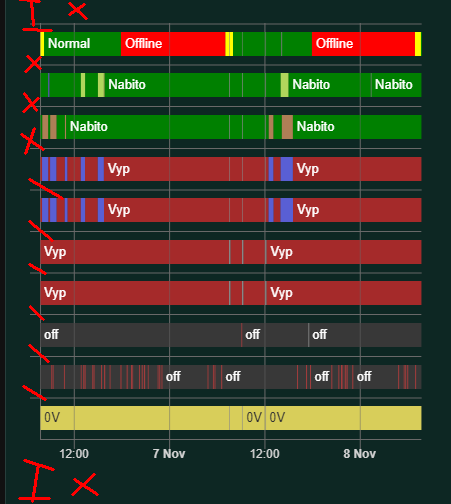
(sorry for my poor painting skills…) 
Hello,
I just found out this card, looks great and it seems it could answer my needs.
One question though, would it be possible to group data by month or by a specific period of time ?
My goal is to show my estimated energy bill by month, a month being from the 9th to 8th.
Some something like that :

thx a lot
While you can change the look of the card quite a bit, it is not meant to be entirely customizable in every detail. You can hide the grid lines by assigning them a color with an alpha of zero. You can make the timelines more compact by switching the tooltip size to slim. Check the readme, it’s all explained in there. There is no native way to remove the space around the graph. You can try to use card-mod for that.
The upcoming version will add monthly as an option to the existing intervals for total increasing values. A month starts on the first day and ends on the last day of the month though. Adding an offset to that is a little strange. I guess it’s for your billing period ? You can create a FR on github if this is something you really need.
Hi,
Yes it is for my billing period,
this feature is kinda missing from eveywhere
apexchart can’t do it, energy dashboard can’t do it …
I find it very strange that no one has implemeted it
I can do a FR indeed.
thx for your help
I can’t find this in the HACS “Add Repository” options…am I missing something here?
I found the card, but now don’t understand how to add it to my dashboard or how to setup a entity to monitor…
Can this be added to the sidebar of HA?
If you want to add a dynamically configurable card simply add a custom card
type: custom:history-explorer-card
If you want to have a card which always portrays the same set of entities, follow the instructions on github.
V1.0.32 is now up with the new entity info panel integration. It also adds monthly intervals for total increasing values (nice when combined with long term statistics) and fixes an annoying LTS bug.
By default, info panel integration is disabled. You will get the normal, native HA info panels. To enable the override, open the pulldown menu on a history explorer card and select Enable history info panel:

Once enabled, all entity history info panels throughout HA will now use the history explorer card, with all its interactive functions. You can disable the integration by selecting the above menu option again. You do not have to restart HA or anything, all is on the fly.
Once the info panel option is enabled, you can directly start using the new info panels, no configuration required. Optionally you can customize them by adding YAML under the infoPanel key on the configuration of any history explorer card on your dashboard. Most config options that work with the normal history explorer custom card will also work for the info panel. Notably, entityOptions and stateColors. Check the readme.
Example:
infoPanel:
  lineMode: stepped
  entityOptions:
    humidity:
      color: green
    temperature:
      fill: rgba(0,0,0,0)
    energy:
      color:
        '0': '#3e95cd'
        '2': '#b5342d'
        '0.5': '#66a61e'

If you don’t want a history explorer custom card on your dashboard (  ), but you still want the new info panel overrides, then you can remove the custom card once you turned on the info panel feature and optionally did the custom configuration.
The info panel override feature works with most versions of HA since 2022.4, you don’t need the most recent HA installed (but it’s obviously supported too !).
As usual, feedback welcome !
14 Likes

Then maybe you haven’t installed the card (use HACS) or your browser cache needs clearing, or perhaps a restart of HA.
This is fantastic and works well.