Different history retention per entity in Home Assistant recorder?

Hi all,

I’m trying to configure Home Assistant so that only two sensors keep long-term history (about 1 year), while all other entities keep the default / shorter retention.

Specifically:

  • sensor.temperature
  • sensor.humidity

From what I understand, the recorder integration only supports a global purge_keep_days value and does not allow different retention periods per entity.

Is there any way to keep 1 year of history for specific entities only

Thanks in advance!

No there isn’t. But long term statistics is something entirely separate from recorder history, and those are kept forever.

Does using the existing long term statistics work for your usecase?

Maybe, I like seeing the temperature over time. How do I apply that?

How about a statistics graph card?

Sorry, but I really don’t understand how History works in Home Assistant.

I read that the default history retention in Home Assistant is 10 days.

If I want to keep data from sensors (power consumption, temperature, etc.) for a longer period, do I need to add state_class: measurement to the sensor?

Does that mean that for sensors that are automatically created by integrations, I would need to make a (template) copy of each sensor in configuration.yaml, reference the original sensor, and then add state_class: measurement there?
That doesn’t seem right to me.


When I look at the History ( history?entity_id=sensor.termometer_02_temperature ) panel now, I can see data going back to mid-December, which is when I started using the sensor. Can I use that existing data to create graphs?


Until now, I have been reading my P1 smart meter and solar panel data myself and storing it in a separate database. This allows me to create a table showing this year’s monthly consumption compared to last year’s monthly consumption, with the current month at the top.

I would now like to integrate this into Home Assistant.

Is it possible to view and use historical data from multiple previous years in graphs within Home Assistant?
I understand that I need to collect more than a year of data in Home Assistant before I can make year-to-year comparisons. I probably won’t import the old historical data (at least I don’t think I will).


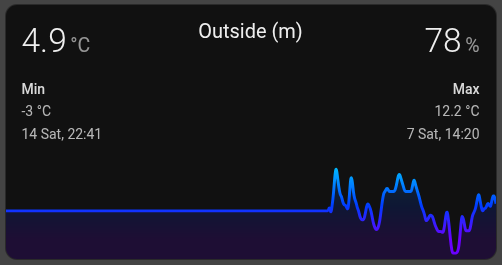
I added the following card. It initially started empty, but after a month it now shows one month of data. How does that work exactly?

type: custom:mini-graph-card
entities:
  - entity: sensor.termometer_02_temperature
    name: Temperature
  - entity: sensor.termometer_02_humidity
    name: Humidity
    show_graph: false
    show_state: true
line_width: 3
smoothing: true
hour24: true
hours_to_show: 744
points_per_hour: 0.5
show:
  legend: false
  name: false
  icon: false
  state: true
  extrema: true
  labels: false
  fill: true
color_thresholds:
  - value: 0
    color: "#6a00ff"
  - value: 5
    color: "#003cff"
  - value: 10
    color: "#00aaff"
  - value: 15
    color: "#00ffd5"
  - value: 20
    color: "#00ff55"
  - value: 25
    color: "#b6ff00"
  - value: 30
    color: "#ffcc00"
  - value: 33
    color: "#ff9900"
  - value: 36
    color: "#ff5500"
  - value: 38
    color: "#ff0000"
  - value: 40
    color: "#8b0000"
card_mod:
  style: |
    ha-card::before {
      content: "Outside (m) ";
      position: absolute;
      top: 10px;
      left: 50%;
      transform: translateX(-50%);
      font-size: 20px;
      color: var(--primary-text-color);
    }

I would suggest not to mix several questions.
The card is supposed to show data right from a beginning - if there is at least one entry in DB. In case of glitches with a graph - try purging a browser cache since the card uses a cache to build graphs faster.

For any advanced use, consider Grafana - it can collect data by itself and then you can use these data for analysis by Grafana tools.

Some integrations provide a “state_class: measurement” (or “total/total_increasing”) for sensors by default. If not - you may try adding the “state_class: measurement” by “customize”:

homeassistant:
  customize:
    sensor.xxx:
      state_class: measurement

This is only applicable for “sensor” entities.
But - if you need to collect UNTOUCHED (i.e. not approx. statistics) data for all entities - consider increasing a default 10-days interval, read Docs for Recorder. (also, you may exclude some entities from being recorded at all, also described in Docs)

Thank you for your response. I thought this was a History-related question (and I still don’t understand what automatically gets longer history retention and what doesn’t).

I also don’t understand how the graph in the card works.

I’m using exactly the same data sources and settings for the card. If I add the same card to the dashboard now, the graph starts displaying data from now.

If I set in the card:

hours_to_show: 744
points_per_hour: 0.5

then it should show up to a maximum of 31 days (744/24).

However:

  • The card with the same sensor that has been on the dashboard for 28 days shows 28 days of history.
  • The card I added 7 days ago shows 7 days.
  • The card that has been there for 2 months shows 31 days.

(This happens in Firefox, Chrome, and in the app, so I assume it’s not related to local cache.)

How does is work it maybe possible that when I create a card, the historical data gets linked to the card’s ID?
So if I clone the card 10 times, would I get 10 different historical timelines starting from the moment each card was created?

So if I add this to configuration.yaml for all the sensors I want to keep longer, I’m saved for the years :wink:

homeassistant:
  customize:
    sensor.thermometer_02_temperature:
      state_class: measurement
    sensor.smart_meter_energy:
      state_class: total_increasing
    sensor.smart_meter_gas:
      state_class: total_increasing

The card takes data from DB.
If the “purge interval = 10” - then there will be no data in DB older than 10 days.
But - the card uses a browser cache as well - and if you purge a browser cache, you will get a freshly created VALID graph based on the current DB content.
Cannot tell about a possible hacking/tweaking a data kept in a cache - would suggest to purge a cache periodically; also, some users intentionally switch off the caching by setting a corresponding option “cache: false” in mini-graph-card - to avoid possible disruptions (so, the card may work a bit slower - but will create valid graphs; usually it is set to “false” while investigating issues).

  1. This should only be added to “sensor” entities which are not template sensors - and only if these sensors do not have some “state_class” already set by an integration which created them. Also, these sensors must be numerical.
  2. Setting some state_class will not make a sensor to be kept in DB forever. It’s data will still be purged after a “purge_interval” from DB. But - for this sensor a so called statistical data will be calculated every 5 minutes, and HOURLY data will be saved in DB and will be kept forever (5-minute data will also be saved - but they will be purged like raw data). Note that these are approximate, not “raw” data.

Sorry, you’re absolutely right. :pensive:
I really thought I had checked it properly — my apologies. (The app also caches the graph data just like the browser, which I didn’t expect.)

Do you know how I can display a longer period than 10 days in a card’s history graph? The history itself is definitely available for more than 10 days.

As I understood it, with the recorder option you only set the number of days for the specified sensor, but then all other sensors would be set to 0 days?

#recorder:
#  purge_keep_days: 365
#  include:
#    entities:
#      - sensor.thermometer_02_temperature


Earlier, I already created an extra sensor with `state_class: measurement`, but that one also only shows 10 days back in the card.
template:
  - sensor:
      - name: "Thermometer 02 Temperature (record)"
        unit_of_measurement: "°C"
        state_class: measurement
        state: "{{ states('sensor.thermometer_02_temperature') }}"

      - name: "Thermometer 02 Humidity (record)"
        unit_of_measurement: "%"
        state_class: measurement
        state: "{{ states('sensor.thermometer_02_humidity') }}"

It is perfectly fine if after 1 week the log points are at 1 hour and after a month at 12 hours or something similar.

How can I use that data in the cards?

How do I know whether a sensor is a regular sensor or a template sensor? And how can I check whether a sensor has already been given a state_class by the integration that created it?

Template sensors are created by you. “Regular” - by integrations (no such term - “regular sensor”).
You need to check docs what “template sensors” are.

Only some cards have access to statistical data - Statistics Graph card, Statistics card. Some custom cards can build graphs from statistics too (not mini-graph-card).

The “state_class” is an attribute of a sensor entity. Go to Dev tools → State & see what attributes every entity has.

I still find this confusing (sorry for that).

So this does not add any real value for creating historical data to populate the cards?

homeassistant:
  customize:
    sensor.termometer_02_temperature:
      state_class: measurement
    sensor.smart_meter_energy:
      state_class: total_increasing

So I cannot create a card with this (for me) nice layout if I want to see more than 10 days of data?

Do I understand correctly that if I want more than 10 days of history, I need to add the recorder configuration in configuration.yaml?
But then this would apply to all sensors, causing the database to grow unnecessarily.
And if I use include with specific entities, all other entities are set to zero (not recorded). So should those then be placed under exclude instead?

How can I set sensor.thermometer_02_temperature to 365 days, while keeping the rest of the sensors at 10 days?

#recorder:
#  purge_keep_days: 365
#  include:
#    entities:
#      - sensor.thermometer_02_temperature

The “state_class = xxx” attribute just tells HA to calculate stats & store them in DB.
Raw historical data will be stored in DB anyway - but not more than for “purge interval” period.

Mini-graph-card does not support stats. It gets only historical data.

Yes. And then set a corresponding option to “> 10 days”.

Google here in Community smth like “how to tame a Recorder”, it will give you a thread about these “include/exclude” settings.

Yes, I had done that before, (not that exact search term), not only did I ask Google, but also AI to think along. (I’ll read it again)

Maybe this will work?

configuration.yaml

recorder:
 purge_keep_days: 365

automation:

alias: Purge old data from dbase
trigger:

  • platform: time
    at: ‘03:00:00’
    action:
  • service: recorder.purge
    data:
    keep_days: 10
    repack: true
    exclude_entities:
    - sensor.thermometer_02_temperature

Cannot check your posted code.
If you need to set a purge interval = 365 → then yes, “purge_keep_days: 365” is OK.
As for the automation - if you need to purge stored DB periodically - yes, you need to call a “recorder.purge” or “recorder.purge_entities” service.

Yesterday I have add this in the configuration.yaml

recorder:
purge_keep_days: 365
auto_purge: true

Reload all yamls and restart Home-Assistant. Do I need to add/change something else?

I checked the oldest visible value in the sensor on February 18 at 17:15; at that time, the oldest value was February 8, 2026 at 07:15.

After that, I cleared the browser data and checked again on February 18 at 17:30; then the oldest value was February 8, 2026 at 07:30.

It seems that everything is shifting forward and that data is not being stored for more than 10 days.

Is there anything else I can debug?

Sensor
ID: sensor.thermometer_02_temperature
state_class: measurement
unit_of_measurement: °C
device_class: temperature
friendly_name: Outside

Check if you defined options for Recorder in a proper way (syntax, indentation etc).
Check logs for errors.

Not needed, a stock History graph does not use cache if I am not mistaken.