I’ve been working on getting Birdnet-Go set up on my instance. This thread has been very helpful for me and I wanted to share my dashboard as it stands after a few days. Since I upload my results to Birdweather, I decided to utilize their graphql API and primarily use that data for my dashboard instead of the Birdnet MQTT sensors described in the add-on. I am pretty happy with my results up to now.
I decided to use a command_line curl command for the API. I found the API documentation to be less than stellar, but here is where I have landed for now:
command_line:
  - sensor:
      name: "Birdweather Detections Station n1234"
      unique_id: birdweather_detections_station_n1234

      command: >
        curl -s \
          -H "Content-Type: application/json" \
          -H "Authorization: Bearer xxxxxxxxxxx" \
          --data '{
              "query": "query StationDetections($stationId: ID!, $first: Int) { station(id: $stationId) { id detections(first: $first) { totalCount nodes { timestamp species { id commonName imageUrl scientificName } speciesId confidence } } } }",
              "variables": { "stationId": "n1234", "first": 100 }
            }' \
          "https://app.birdweather.com/graphql" | jq --arg now "$(date -Is)" '{
            stationId: .data.station.id,
            totalDetections: .data.station.detections.totalCount,
            lastDetection: (
              .data.station.detections.nodes |
              map(.timestamp) |  # Extract all timestamps
              max  # Find the maximum (latest) timestamp
            ),
            species: (
              .data.station.detections.nodes |
              group_by(.species.commonName) |
              map(
                {
                  speciesName: .[0].species.commonName,
                  totalCount: length,
                  lastSpeciesDetection: (
                    sort_by(.timestamp) |  # Sort by timestamp within the group
                    .[length - 1].timestamp   # Get the last (latest) timestamp
                  ),
                  scientificName: .[0].species.scientificName,
                  imageUrl: .[0].species.imageUrl
                }
              )
            ),
            lastResponse: $now
          }'
      scan_interval: 60
      unit_of_measurement: ''
      value_template: >
        {{ value_json.totalDetections }}
      json_attributes:
        - totalDetections
        - stationId
        - lastDetection
        - lastResponse
        - species
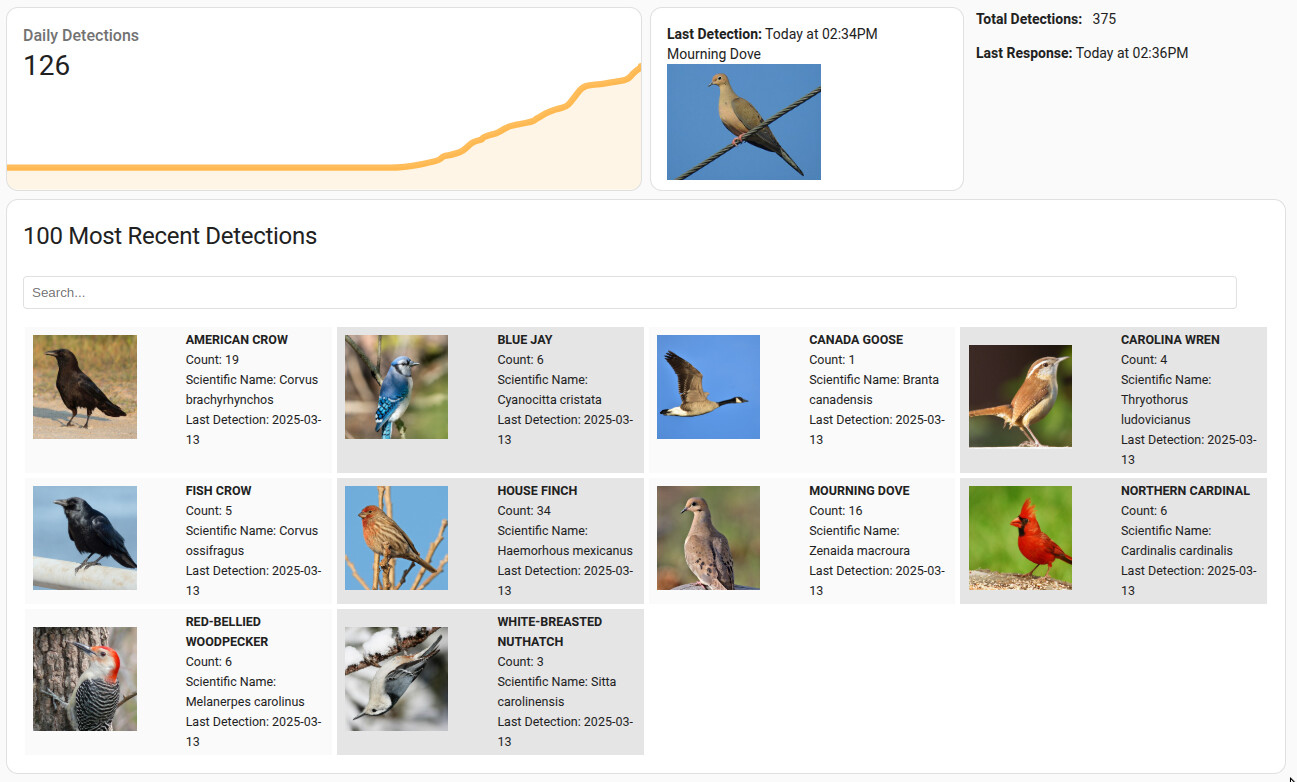
This gets me: total detections for my station, the last detection datetime, the last API response datetime, my station ID, and the last 100 detections grouped by common name, and including the total count detected, the last time the species was detected, the scientific name for the species, and image URL for the species all in a single sensor.
I started with markdown cards for displaying the top 100 detections, but changed to flex-table-card for a cleaner (and theoretically easier to set up) look. I created two layouts, one for desktop/tablet and one for mobile view. Slightly different but providing the same information.
Desktop dashboard:
For desktop, I use flex-table-card and card_mod to move it to a horizontal view:
type: custom:flex-table-card
title: 100 Most Recent Detections
entities:
  - entity: sensor.birdweather_detections_station_nnnnn
columns:
  - name: ""
    data: species.imageUrl
    modify: "'<img src=\"' + x + '\"style: width=75%; height=auto;\">'"
  - name: ""
    data: species
    modify: >
      "<strong><span style=\"text-transform: uppercase;\">" + x.speciesName +
      "</span></strong>" +
      "<br>" +
      "Count: " + x.totalCount +
      "<br>" +
      "Scientific Name: " + x.scientificName +
      "<br>" +
      "Last Detection: " + x.lastSpeciesDetection.substring(0, 10)
search: true
grid_options:
  columns: 48
  rows: auto
card_mod:
  style: |
    table {
      display:table !important;
    }
    tbody {
      display: grid !important;
      grid-template-columns: repeat(4, 1fr);
      grid-gap: 10px;
    }
    tr {
      grid-column: auto;
    }
    td {
      float: none !important;
      display: table-cell !important;
      width: 50% !important;
      max-width: none !important;
    }
    thead {
      display: none !important;
    }
    tfoot {
      display: none !important;
    }
The other cards are just the sensor and markdown cards.
Mobile dashboard:
type: custom:flex-table-card
title: 100 Most Recent Detections
entities:
  - entity: sensor.birdweather_detections_station_12159
columns:
  - name: ""
    data: species.imageUrl
    modify: "'<img src=\"' + x + '\"style: width=75%; height=auto;\">'"
  - name: ""
    data: species
    modify: >
      "<strong><span style=\"text-transform: uppercase;\">" + x.speciesName +
      "</span></strong>" +
      "<br>" +
      "Count: " + x.totalCount +
      "<br>" +
      "Scientific Name: " + x.scientificName +
      "<br>" +
      "Last Detection: " + x.lastSpeciesDetection.substring(0, 10)
search: true
grid_options:
  columns: 24
  rows: auto