Hi.
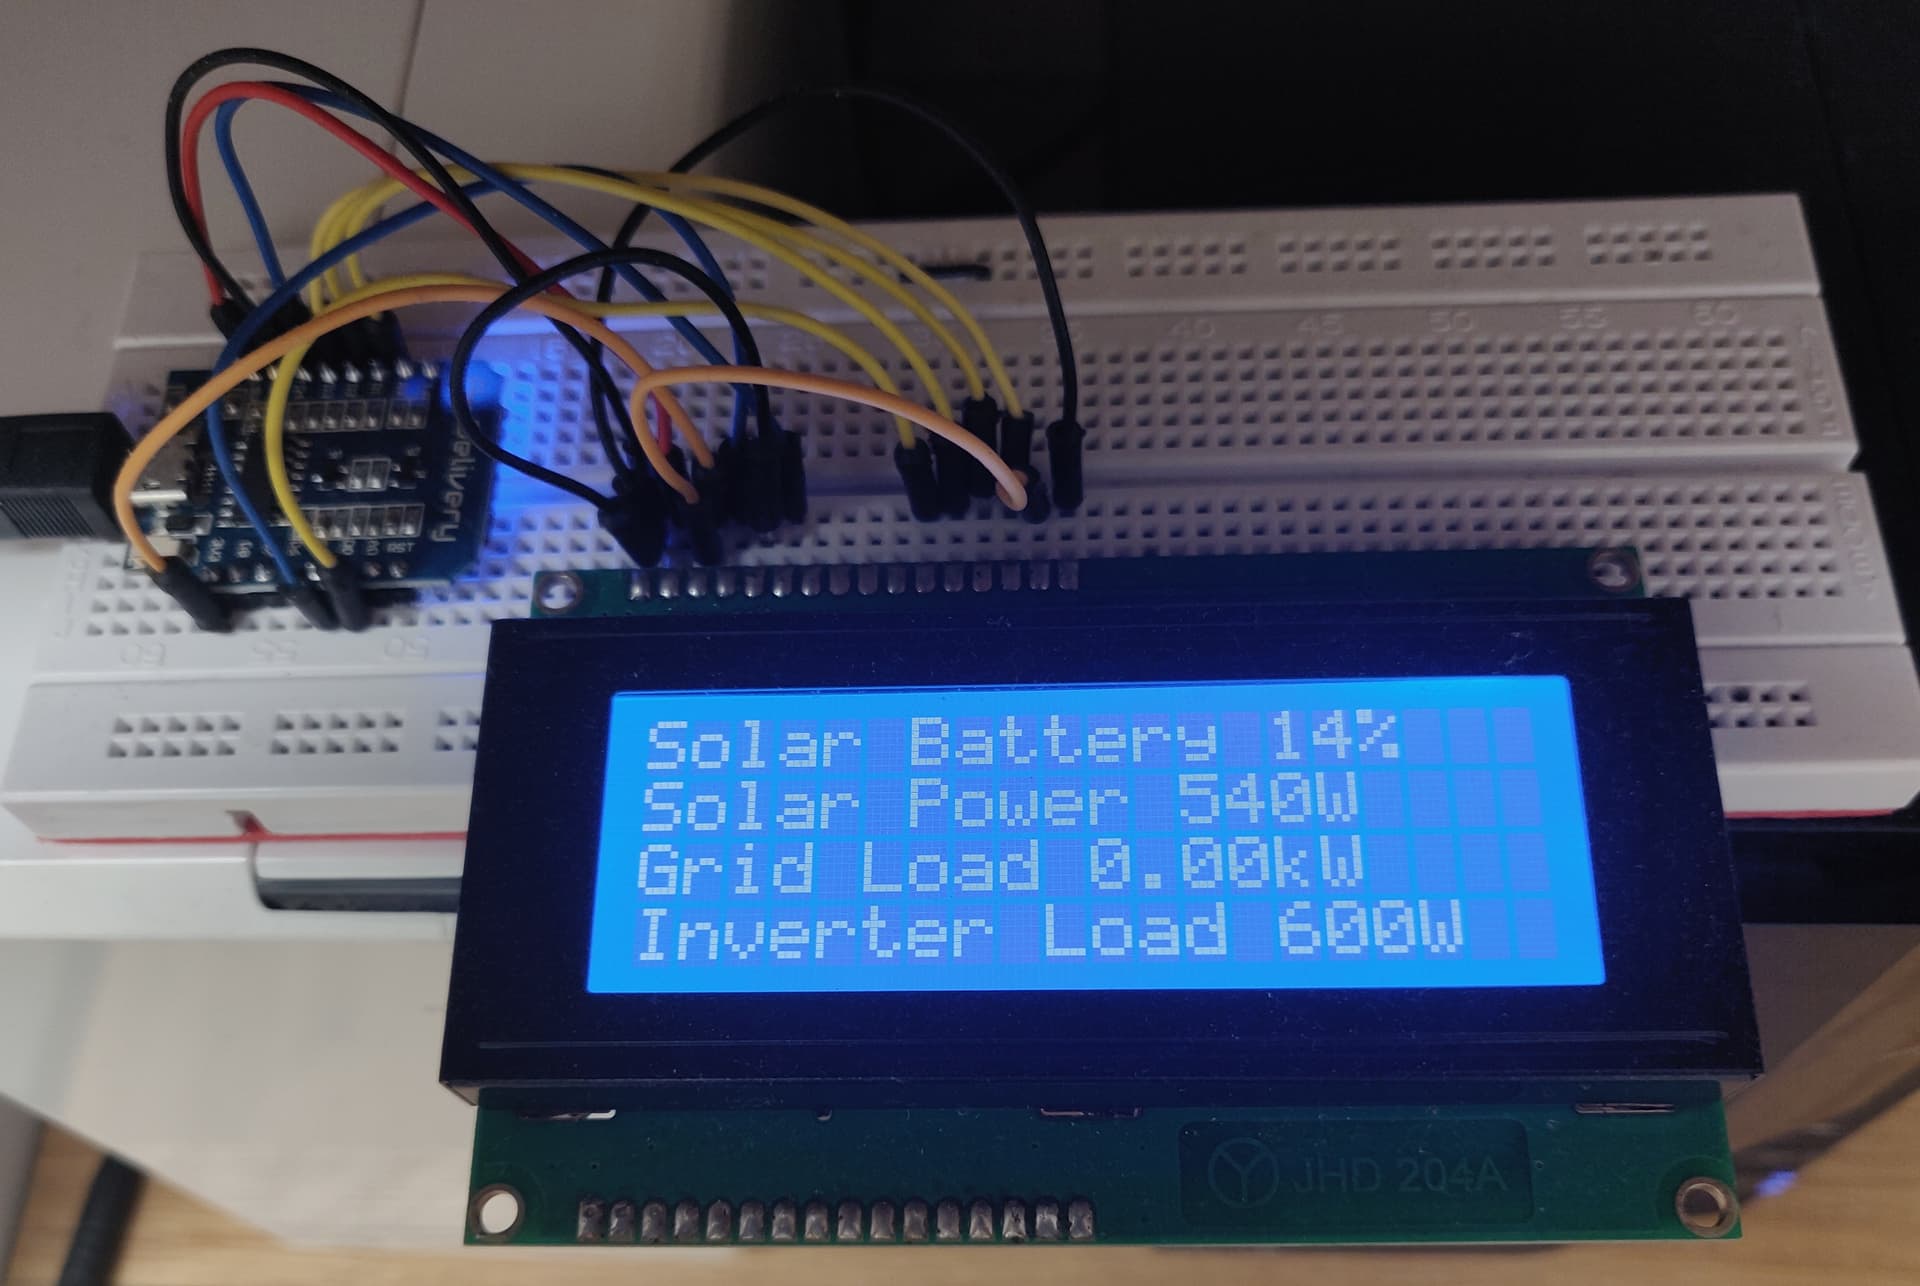
I’ve built a small display to show info from my Solar inverter. I also have a battery and I’m trying to create a simple filter to show an up or down arrow if the battery is charging or discharging.
I’m using a 20x4 LCD screen and can display the static symbols but I can’t figure out how show them from a filter.
sensor:
  - platform: homeassistant
    id: solar_battery
    name: "Solar Battery"
    entity_id: sensor.battery_charge
  - platform: homeassistant
    id: solar_power
    name: "Solar panel power"
    entity_id: sensor.growatt_pv_active_power
  - platform: homeassistant
    id: inverter_load
    name: "Inverter load"
    entity_id: sensor.growatt_power_phase_a
  - platform: homeassistant
    id: grid_load
    name: "Grid load"
    entity_id: sensor.load
  - platform: homeassistant
    id: battery_charging
    name: "Battery Charging Power"
    entity_id: sensor.battery_charging_power

display:
  - platform: lcd_gpio
    dimensions: 20x4
    data_pins:
      - D0
      - D1
      - D2
      - D3
    enable_pin: D4
    rs_pin: D5

    user_characters:
      - position: 1
        data:
          - 0b00000
          - 0b00000
          - 0b00000
          - 0b00000
          - 0b00000
          - 0b10001
          - 0b01010
          - 0b00100
      - position: 2
        data:
          - 0b00100
          - 0b00100
          - 0b00100
          - 0b00100
          - 0b00100
          - 0b11111
          - 0b01110
          - 0b00100

    lambda: |-
      it.printf(0, 0, "Solar Battery %.0f%%", id(solar_battery).state);

      it.printf(0, 1, "Solar Power %.0fW", id(solar_power).state);

      it.printf(0, 2, "Grid Load %.2fkW", id(grid_load).state);

      it.printf(0, 3, "Inverter Load %.0fW", id(inverter_load).state);
      on_value_range:
        if:
          condition:
            sensor.in_range:
              id: battery_charging
       - above: 50.0
         then:
         - lambda: |-
            it.printf(19, 0, "\x5E");
#  - number:
#      platform: template
#      id : battery_charging.state
#      on_value_range:
#      above: 50
#      below: 3500
#        lambda: |-
#          it.printf(19, 0, "\x5E");


#      it.printf(19, 0, "\x5E"); # up arrow
#      it.printf(19, 1, "\x01"); # down arrow
#      it.printf(19, 3, "\x02"); # big down arrow
#      it.strftime(15, 2, "%H:%M", id(my_time).now());
I’ve tried “on_value_range” under lambda but I get errors when compiling. “it.printf(19, 0, “\x5E”);” should print an up arrow in the top right digit when charging power is above 50 watts.
Any help appreciated. I’m probably doing this completely wrong, I’ve been round the docs but I’m no further forward.