Hello! Is it possible to duplicate the whole Energy Dashboard?
I have 1 HA server to monitor 3 flats in the same Villa that share 1 Electric meter. My energy dashboard monitors the total kWh and each flat is a monitored device so I know how many kWh is used by each flat.
This way I miss the single appliace and I don’t want to add them since they are already “inside” that flat kWh total.
Solution is to have separate energy dashboard for each flat. Is is possible? How to achive it?
@tom_l thanks for your reply. Any hint how to achive it? I found out the cards used for the energy dashboard are not possibile to configurate for another dashboard and I don’t find any suitable lovelace energy card. I found only some cards that shows only the actual data without history. I am not really able to create one from scratch
from here: Energy Cards - Home Assistant " At the moment there are no configuration options available for these cards, you can configure them on the energy configuration page". Maybe I misunderstood the sentence. I will check better
Hello, I do not understand how to copy some energy cards to another dashboard. My energy dashboard is OK, but I would like to add some other cards. So I created an empty dashboard, clicked add card, and searched for e.g. energy-usage-graph but this was impossible to find.
You have to use YAML. Easiest way is to add any card (e.g. button card) then press the SHOW CODE EDITOR button at the bottom left and replace the YAML with the examples from my link above.
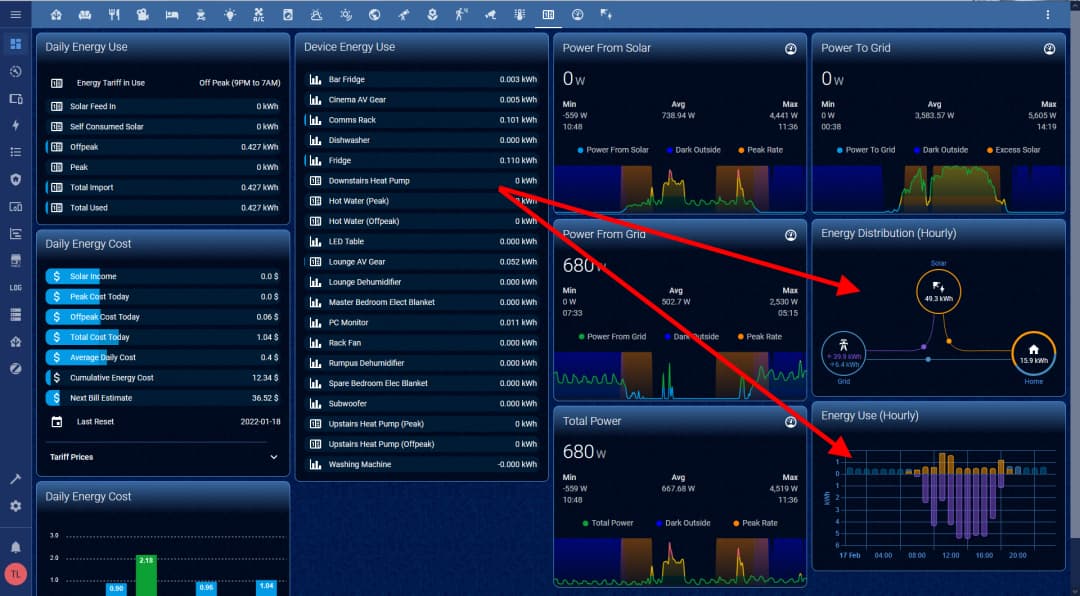
Hello, would you mind sharing your yaml code related to the energy cards you show on the screenshot ? I likenthem and need to build an energy dashboard for my tablet.
Also do you know how much we can get historical data from the past ? 1 month? 1 year ?
My energy history is going back to 2022 (the year I installed the meters).
You can find the .yaml code on the url metioned by tom_l above your comment.
The card colours come from a global card-mod theme which is not an easy thing to maintain or understand. In fact I barely understand it now and I wrote it. Unless you mean the chart line colours. They are just:
Thank you Tom, I am beginning to introduce card-mod in my yaml now … so I should be able to understand
What cards are those (Mini-graph cards or … ??) they are pretty nice.
Would you please share your code for one of those cards ? I can then check it out myself to understand it