I have been struggling on a good way to display lightning strikes on a dashboard. I have Ecowitt set up with the lightning detector which provides distance and strike counts. I have tried creating various calculations, time stamps, etc. but cannot find a good way to display the data when there are strikes. Anyone have any good ideas or examples?
I did not know this existed, cool to hear.
There are a few things you can try, dashboards and visualisations are very dependent on taste so see what you like.
Add visibility condition(s) under the card so it will not show unless there is lightning detected
Display an animation in a card
Adapt the icon/color/size of the font on the card depending on the amount or the distance of the strikes
(Not really what you asked) Link other things to the information: send out a notification reminding you to unplug unnecessary things from the outlets
You might need a card-mod to do some if the things in the list though.
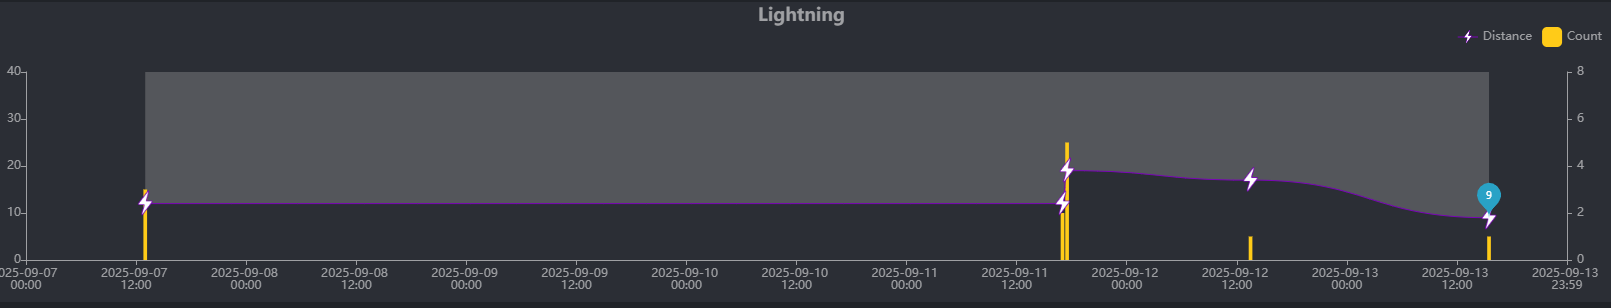
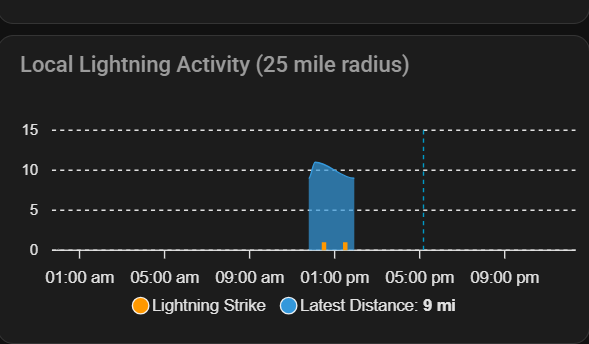
Thanks, yes have various graphs but they dont seem to represent it well. I really want to replicate what Ecowitt dashboard does but in HA and so far I cannot get it to show similar, it never quite works so anyone managed it I would be interested.