Hi,
I have a very similar scenario. I am also using the local Tuya Integration to read my smartplugs power reading in Watts and then using the Riemann sum integral to get the energy spent using the default trapezoid setting. The smartplug is connected to my laundry dryer (condenser dryer without heat pump). Depending on the dryer load, it should draw between 2.27 kW/h and 4.13 kW/h, according to the datasheet. In fact, depending on the day and maybe luck, the Riemann integral actually integrates values in that range, on other days and maybe with less luck, the result of the Riemann integral is more than 10 times as high, and I have no idea what could be causing this.
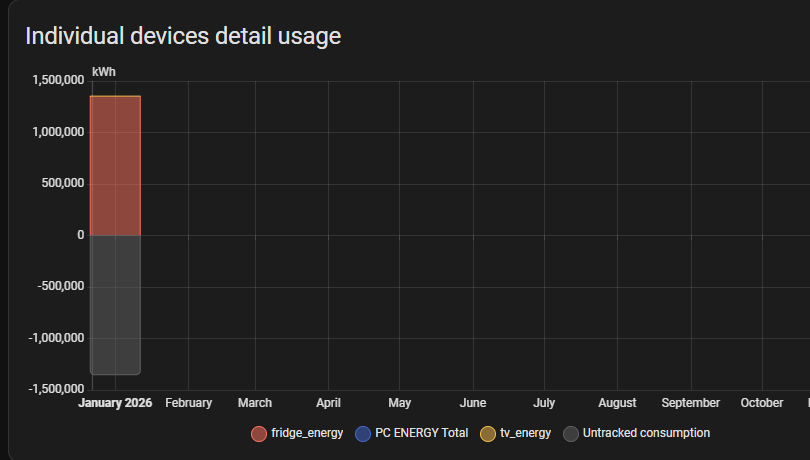
I will attach the screenshots of two workloads, one resulting in 3.64 kW/h and another where it results in 74.02 kW/h, which obviously can’t be right. Maybe someone has some idea what could be going wrong here?
Normal Range:
Wrong Result:
This is my config:
#-------------------------------------------------------------------------------
    #LOCAL TUYA RIEMAN INTEGRATIONS
  - platform: integration
    source: sensor.laundry_dryer_power
    name: laundry_dryer_energy_spent
    unique_id: laundry_dryer_energy_spent_id
    unit_prefix: k
    round: 2
Thx a lot in advance.
EDIT: I tried to export the data from the SQLite Database but my query didn’t work, so I used alexarch21/history-explorer-card to export the data for the 19th of January as a .csv File. Next Step, integrate the Riemann sum myself.
Here is the data:
Time stamp,State
sensor.laundry_dryer_power
2023-01-18 16:02:07,0.0
2023-01-19 13:50:05,2220.8
2023-01-19 13:51:13,2141.4
2023-01-19 13:51:15,878.4
2023-01-19 13:51:17,26.3
2023-01-19 13:51:19,294.6
2023-01-19 13:51:49,2116.2
2023-01-19 13:52:19,7.2
2023-01-19 13:52:21,2170.1
2023-01-19 13:53:02,2840.2
2023-01-19 14:15:45,2138.6
2023-01-19 14:16:21,2615.4
2023-01-19 14:17:50,2405.5
2023-01-19 14:17:52,2116.2
2023-01-19 14:18:33,2273.8
2023-01-19 14:18:35,2840.2
2023-01-19 14:19:33,2767.4
2023-01-19 14:20:03,2116.2
2023-01-19 14:20:33,2835.3
2023-01-19 14:21:19,2840.2
2023-01-19 14:21:21,2502.2
2023-01-19 14:21:23,2121.8
2023-01-19 14:22:15,2251.6
2023-01-19 14:22:17,2840.2
2023-01-19 14:23:09,2099.8
2023-01-19 14:24:26,2835.3
2023-01-19 14:25:11,2121.8
2023-01-19 14:26:09,2144.3
2023-01-19 14:26:11,2449.2
2023-01-19 14:26:13,2870.5
2023-01-19 14:26:51,2791.3
2023-01-19 14:26:53,2113.5
2023-01-19 14:28:08,2119.0
2023-01-19 14:28:10,2387.8
2023-01-19 14:28:12,2840.2
2023-01-19 14:28:48,2734.7
2023-01-19 14:29:18,2133.0
2023-01-19 14:30:13,2434.5
2023-01-19 14:30:15,2830.3
2023-01-19 14:30:57,2835.3
2023-01-19 14:30:59,2586.2
2023-01-19 14:31:01,2116.2
2023-01-19 14:32:22,2573.8
2023-01-19 14:32:24,2840.2
2023-01-19 14:32:59,2791.3
2023-01-19 14:33:01,2135.8
2023-01-19 14:34:25,2105.2
2023-01-19 14:34:27,2791.3
2023-01-19 14:35:04,2744.0
2023-01-19 14:35:34,2102.5
2023-01-19 14:36:41,2119.0
2023-01-19 14:36:43,2423.5
2023-01-19 14:36:45,2825.4
2023-01-19 14:37:21,2187.7
2023-01-19 14:39:12,2734.7
2023-01-19 14:39:49,2573.8
2023-01-19 14:39:51,2127.4
2023-01-19 14:42:21,2094.3
2023-01-19 14:42:24,2767.4
2023-01-19 14:43:01,2452.9
2023-01-19 14:43:31,2121.8
2023-01-19 14:45:22,2510.0
2023-01-19 14:45:24,2815.5
2023-01-19 14:45:54,2387.8
2023-01-19 14:45:56,2088.9
2023-01-19 14:48:04,2475.4
2023-01-19 14:48:06,2796.1
2023-01-19 14:48:38,2083.6
2023-01-19 14:51:35,2152.8
2023-01-19 14:51:37,2835.3
2023-01-19 14:52:08,2097.1
2023-01-19 14:55:28,2102.5
2023-01-19 14:55:30,2791.3
2023-01-19 14:56:00,2108.0
2023-01-19 14:56:30,955.7
2023-01-19 14:57:00,187.3
2023-01-19 14:57:30,979.4
2023-01-19 14:58:00,2119.0
2023-01-19 15:01:59,2105.2
2023-01-19 15:02:01,1162.2
2023-01-19 15:02:31,954.0
2023-01-19 15:03:01,2105.2
2023-01-19 15:06:31,949.5
2023-01-19 15:07:07,1109.6
2023-01-19 15:07:09,2138.6
2023-01-19 15:10:58,977.6
2023-01-19 15:11:34,954.0
2023-01-19 15:11:36,2044.1
2023-01-19 15:16:56,2051.9
2023-01-19 15:16:58,981.7
2023-01-19 15:17:36,1889.1
2023-01-19 15:22:13,1318.3
2023-01-19 15:22:15,926.1
2023-01-19 15:22:45,173.7
2023-01-19 15:24:48,174.3
2023-01-19 15:24:50,195.9
2023-01-19 15:25:22,174.6
2023-01-19 15:28:19,198.0
2023-01-19 15:28:49,183.3
2023-01-19 15:30:38,92.3
2023-01-19 15:30:40,0.0
2023-01-19 15:31:10,199.8
2023-01-19 15:31:40,0.0
2023-01-20 00:44:01,unavailable
2023-01-20 00:44:03,0.0
EDIT2:
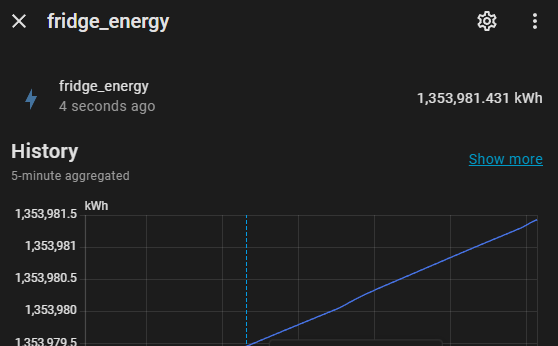
It looks like the faulty integrations are interpolating from the beginning of the day (midnight) until the first spike. It looks like this:
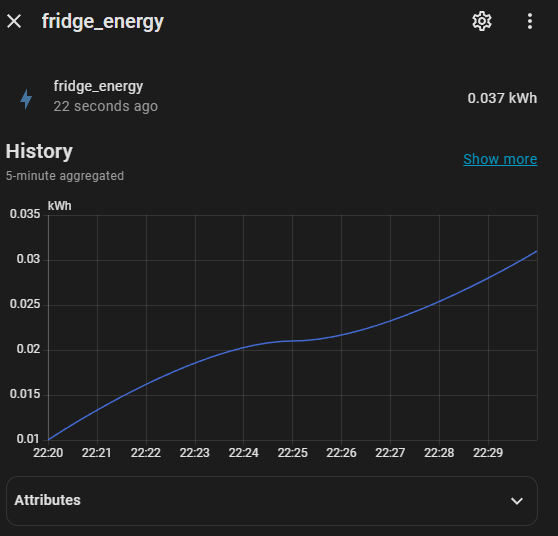
whereas a normal integration doesn’t do this: