Edit: I’m only allowed one image as a new user, so removed pictures and will attempt to add as comments.
I’m having some issues attempting to configure the energy dashboard in HA to show correct values, particularly during 0000-0100 every day - we are currently in British Summer Time (BST), so this would be 2300-000 UTC, which I suspect is affecting things.
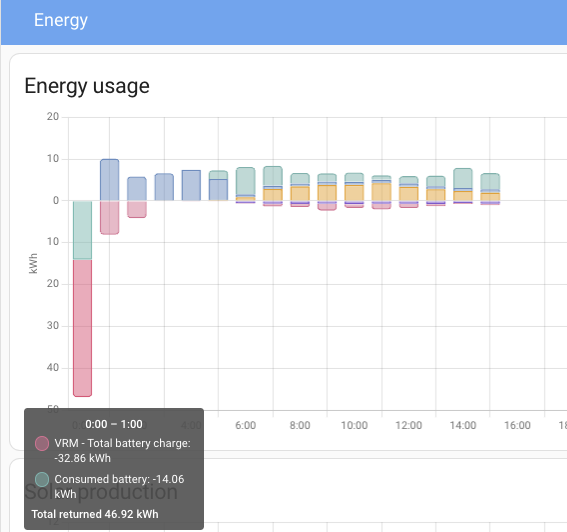
For example, in the energy dashboard, I’m seeing a battery charge of 32.86kwh
Whereas the values of the underlying sensor used are correctly reset to 0000 at midnight (local/BST) as expected…
… for a ‘total increasing’ energy sensor, as I understand it - the values are sourced from the victron VRM web api; I’m calculating total battery charge as the sum of two values:
Derived from some REST sensors, config as listed at the end of the post.
However, for 0100-0200, the values appear to match (and are correct):
Dashboard, showing 8.1kwh of battery charge:
Sensor - 16.09kwh at 0200, and 8.01 at 0100 = total of ~8.1 during this hour slot.
I’d be grateful for any advice on how to get this information to report properly, as it’s throwing off my daily totals/stats.
Sensor config:
rest:
  - scan_interval: 60
    resource_template: https://vrmapi.victronenergy.com/v2/installations/193584/stats?end={{ int(as_timestamp(now()))-1 }}&interval=days&start={{ int(as_timestamp(now().date())) }}&type=live_feed
    headers:
      X-Authorization: Token 2cbb45c0958bc9050c9d50e68d05ca5afcb6195c4892977485d01a122e7206ad
    sensor:
      - name: "VRM totals"
        json_attributes:
         - grid_history_to
         - grid_history_from
         - total_solar_yield
        json_attributes_path: "$.totals"
        value_template: "OK"
  - scan_interval: 60
    resource_template: https://vrmapi.victronenergy.com/v2/installations/193584/stats?end={{ int(as_timestamp(now()))-1 }}&interval=days&start={{ int(as_timestamp(now().date())) }}&type=consumption
    headers:
      X-Authorization: Token <REDACTED>
    sensor:
      - name: "VRM consumption totals"
        json_attributes:
         - Bc # consumption FROM battery
         - Pc
         - Gc # consumption FROM Grid
        json_attributes_path: "$.totals"
        value_template: "OK"
  - scan_interval: 60
    resource_template: https://vrmapi.victronenergy.com/v2/installations/193584/stats?end={{ int(as_timestamp(now()))-1 }}&interval=days&start={{ int(as_timestamp(now().date())) }}&type=grid
    headers:
      X-Authorization: Token <REDACTED>
    sensor:
      - name: "VRM grid totals"
        json_attributes:
         - Gb # grid TO battery
         - Pc
        json_attributes_path: "$.totals"
        value_template: "OK"
  - scan_interval: 60
    resource_template: https://vrmapi.victronenergy.com/v2/installations/193584/stats?end={{ int(as_timestamp(now()))-1 }}&interval=days&start={{ int(as_timestamp(now().date())) }}&type=solar_yield
    headers:
      X-Authorization: Token <REDACTED>
    sensor:
      - name: "VRM grid solaryield"
        json_attributes:
         - Pb # solar TO battery
        json_attributes_path: "$.totals"
        value_template: "OK"


