Hello,
Due to a lack of a Gas Smart Meter, I did a lot of work to manual calculate rough gas usage based on the duration it is in Heat HVAC mode.
I have a sensor that monitors HVAC action on the boiler and then a History Stats that looks at the first to log the duration that the boiler is Heating.
I then have the following sensor to calculate the respective gas usage, covering hours into m3.
  - sensor:
      - name: Heating Gas
        unique_id: heating_gas
        device_class: gas
        unit_of_measurement: "m³"
        state: "{{ ((states('sensor.boiler_single_mode_today') | float * 0.721487309) + (states('sensor.boiler_dual_mode_today') | float * 1.097915471)) | round(5) }}"
        state_class: total_increasing
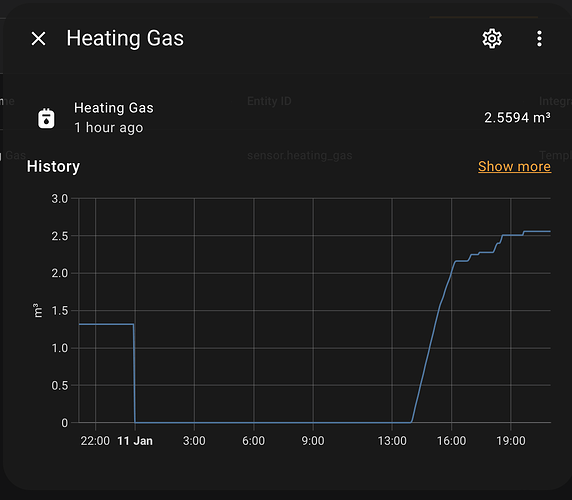
This gives me the ideal result, showing exactly what I would expect:
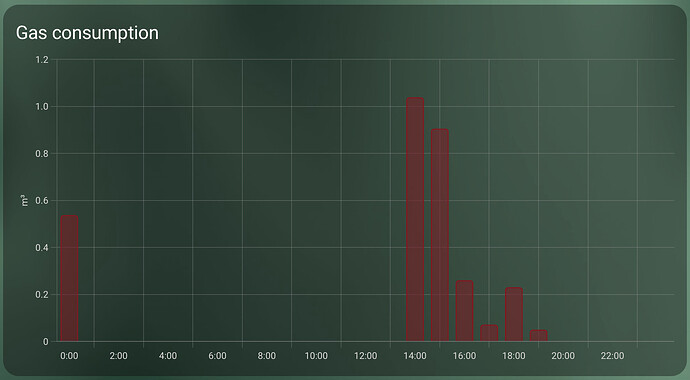
However, in the energy dashboard, I have a spike at midnight which doesn’t match the sensor. This is skewing the energy data. ![]()
5uB2YBAoKcvt8ayIqNo9KIYRvB.jpeg)
Does anyone know why this might be?

