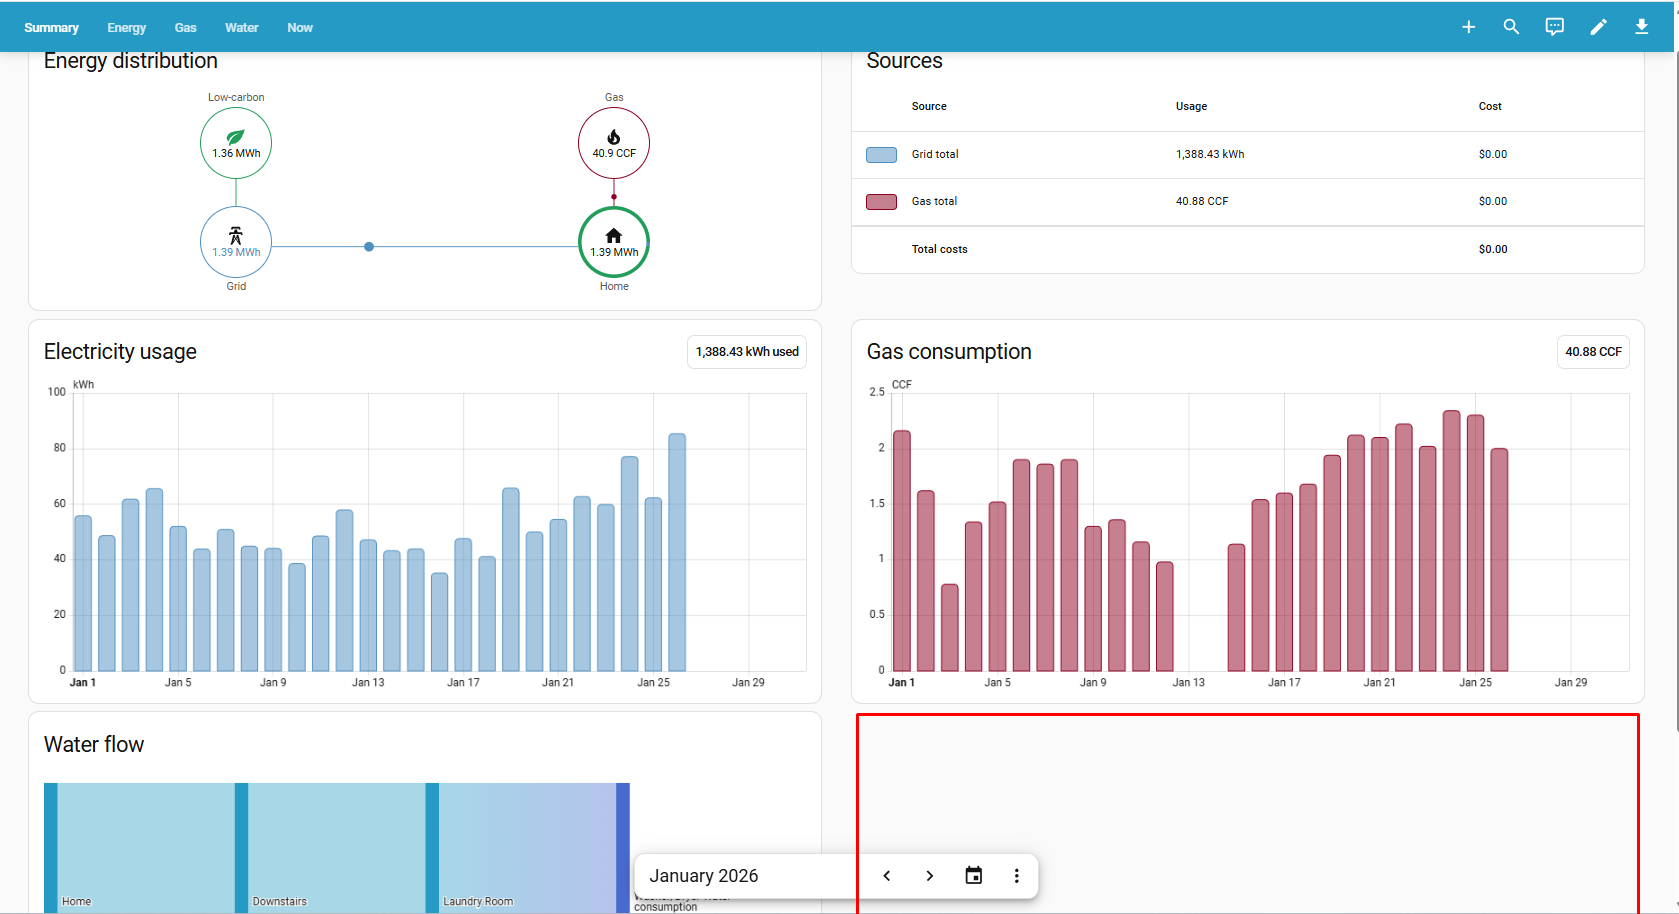
In the Energy Dashboard the Energy Summary Tab has a Water Flow Sankey Chart but I seem to be missing the Energy Flow Sankey Chart?
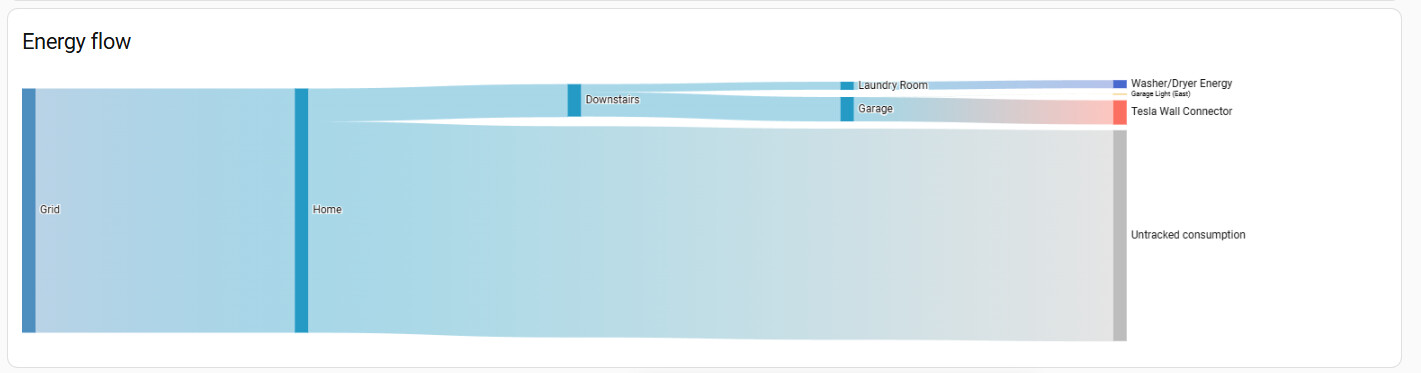
I know my small handful of devices are correctly set up to track Energy Flow as the Energy Flow Chart appears with data in the Energy tab:
Is there a setting or toggle I’m missing to include it in Summary Tab or is this perhaps a Bug? It seems like there is a space for it?
My Water Flow Chart is rather silly since I only have one device that tracks water but it’s fairly easy to track Energy Flow with even basic IoT devices so it’s seems like it would be worthwhile to show Energy Flow under the summary if I had to chose one or the other. (But why not both)?