Good morning!
I have added a Hichi IR WiFi reader to receive the current consumption from my smart meter.
This is sending total positive and negative kWh.
Current power on L1, L2, L3 & all.
Since it is just a sensor without a unit
state_class: measurement
friendly_name: Smart-Meter ENERGY counter_pos
 4315.412
sensor.smart_meter_energy_counter_pos
I´ve added this configuration to get a real energy sensor:
      # Aktueller Netzbezug (Zählerstand)
      - name: "Netzbezug Gesamt"
        unique_id: netzbezug_gesamt
        state: "{{ states('sensor.smart_meter_energy_counter_pos') | float(0) }}"
        unit_of_measurement: "kWh"
        device_class: energy
        state_class: total_increasing
Which leads to the enity:
sensor.netzbezug_gesamt
Netzbezug Gesamt
4315.412
 state_class: total_increasing
unit_of_measurement: kWh
device_class: energy
friendly_name: Netzbezug Gesamt
This finally can be added to the energy dashboard and off course shows an incredible consumption on the first day. Fully understandable!
But now I have a peak on each day, which totally messes up my dashboard:
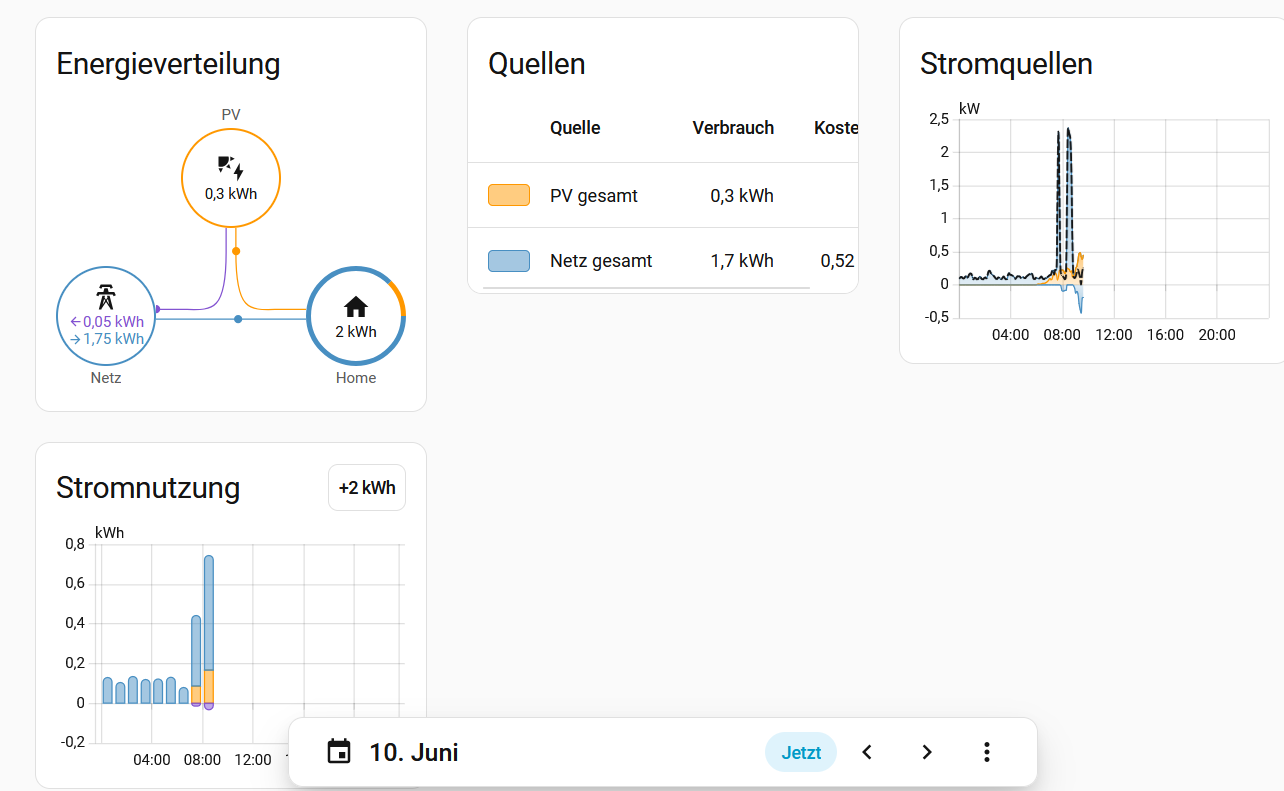
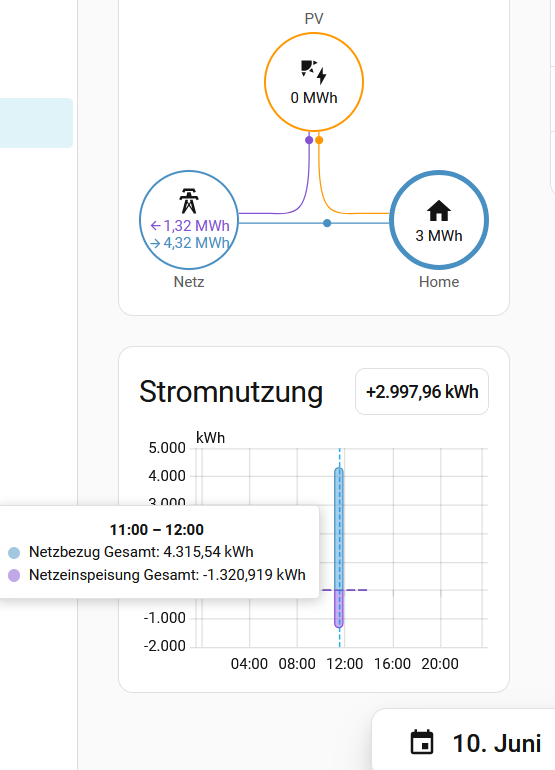
Today is (until now) fine
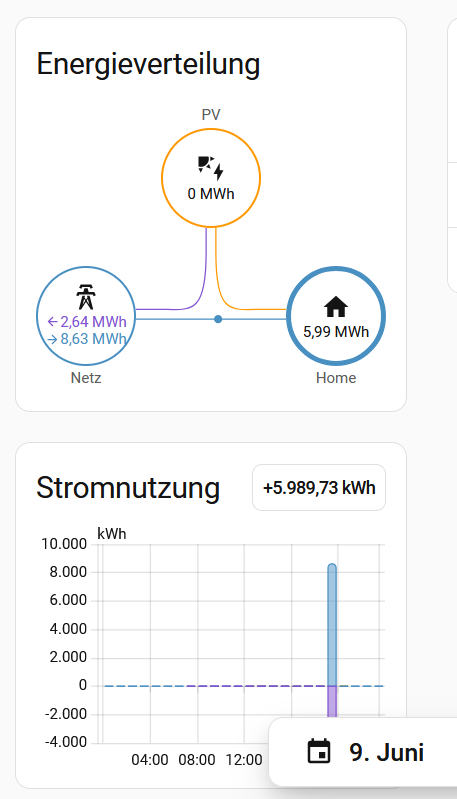
Yesterday 6 Mega Watt hours:
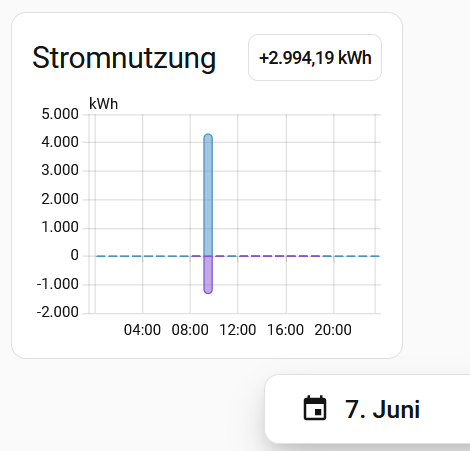
The day before:
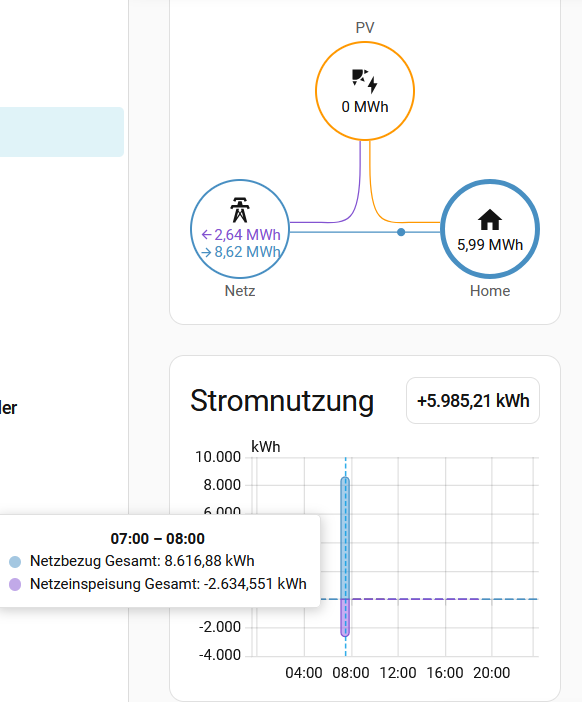
Here with a different peak:
The times are different on any day. Sometimes at 8am, then 9am or 7pm there is a huge misreading.
How can I check where this is coming from?
I thougth this might be related to the german localization with a comma as a seperator. But the values seem to be correct.
Any Idea?
Hi,
It looks like the measuring device you use causes these spikes. I have some zwave device that do the same, randomly give one crazy value for energy and provide the correct value on the next update. I would see if Hichi is known for this issue and maybe have a firmware update to solve it.
Cheers Rene
Allright! I´ve searched all around the web to find a matching Firmware.
But it seems that the "Hichi" solution is based on Tasmota, but has an additional console-feature.
So I cannot find a newer version.
During that, I worked myself through the whole FAQ and found that:
There is a possibility to flatten the values by just setting a "16" before the baudrate in the script.
I´ve now change that and will see if those spikes stopped 
Thanks for pointing me into the right direction!
This was not the solution 
It is really strange, that this happens reliably once a day. At a different time.
But when this really would be a "strange" missinterpreted number, this must appear zero to several times a day.
Is there any way to see what was logged? Or how to identify the problem?
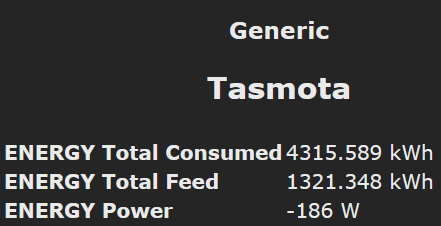
EDIT: What I can tell is, that this is exactly the meter reading
Which is different to the days before.... I guess the subtraction from previously stored values does not work properly?!
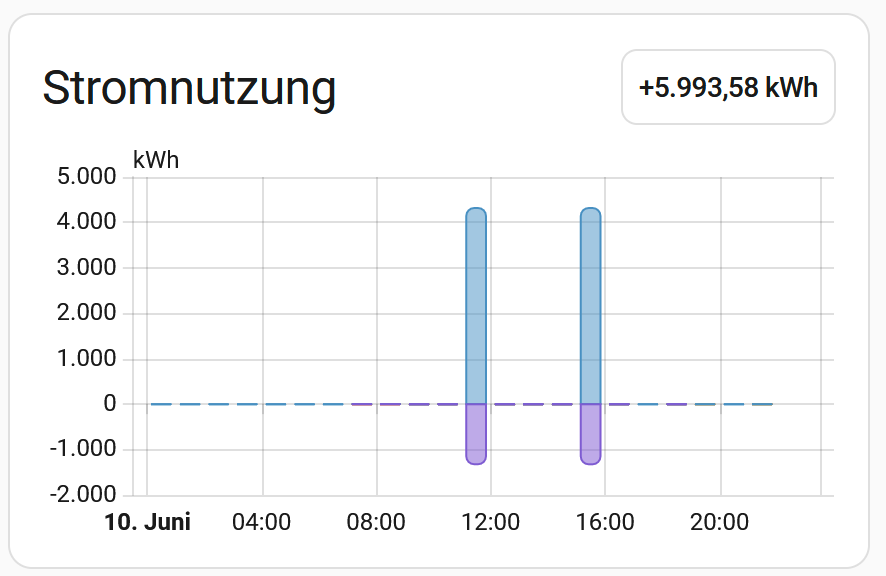
So it happens twice today
Two times the actual full meter reading (
without subtracting the previous value).
Now the interesting part:
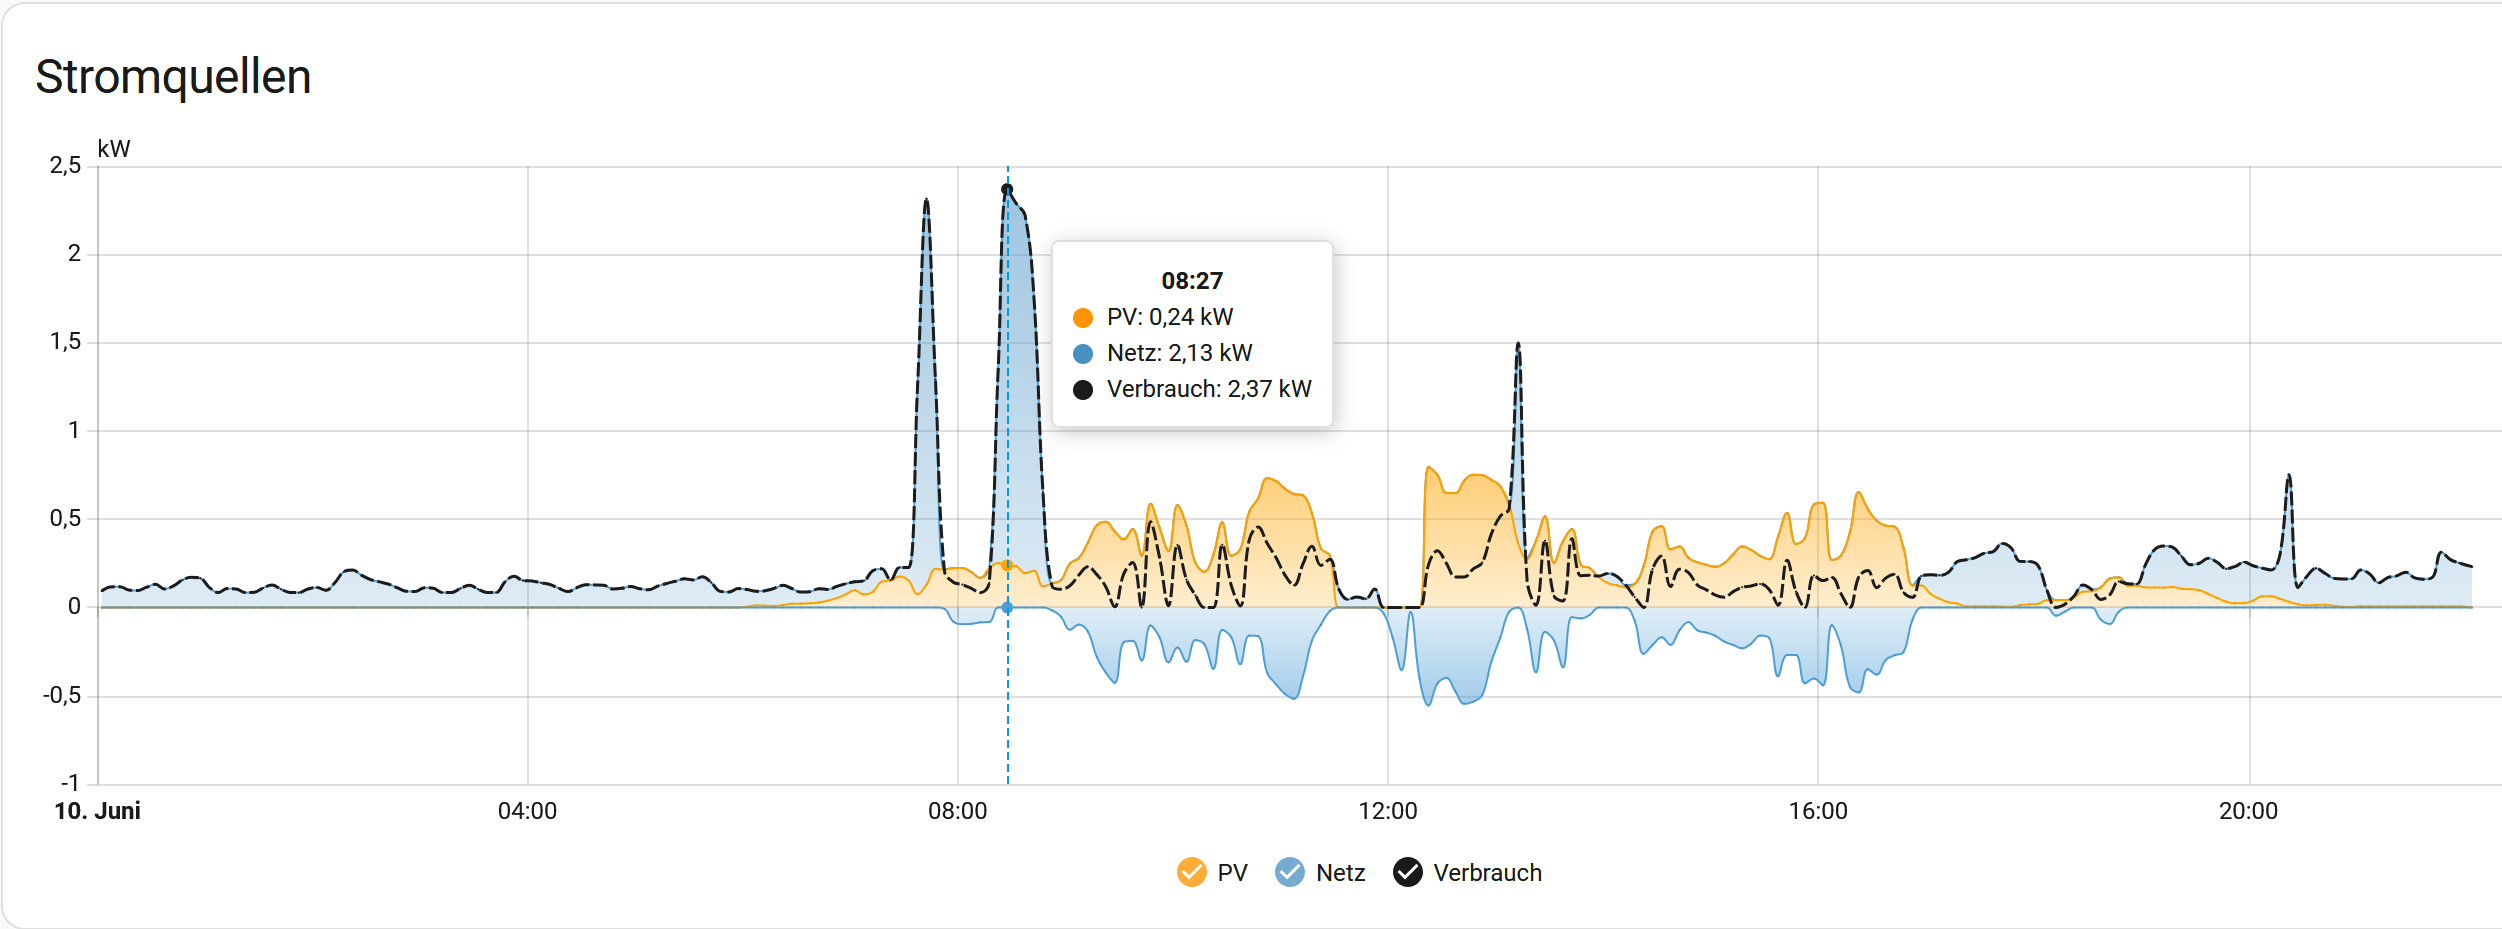
Changing to the current energy sources, it shows the correct values
Or does this only depends on the current Watts?
Whatever, it seems that the energy dashboard "forgets" the last value and subtract nothing from the current total consumed energy.
From my opinion, it is not related to wrong readings. It is the correct total which is taken. It´s something on this automatic dashboard 
It is now working for 10 days.
I can only guess it was related to a faulty WiFi repeater, which made some trouble on other devices.
Hopefully this is now resolved by... itself?!?