Energy Dashboard - keep getting 1 spike every midnight

I have had multiple posts in the past (long time ago) but never managed to solve this issue. I have searched but could not find a better place than to start with a fresh topic to ask for help.

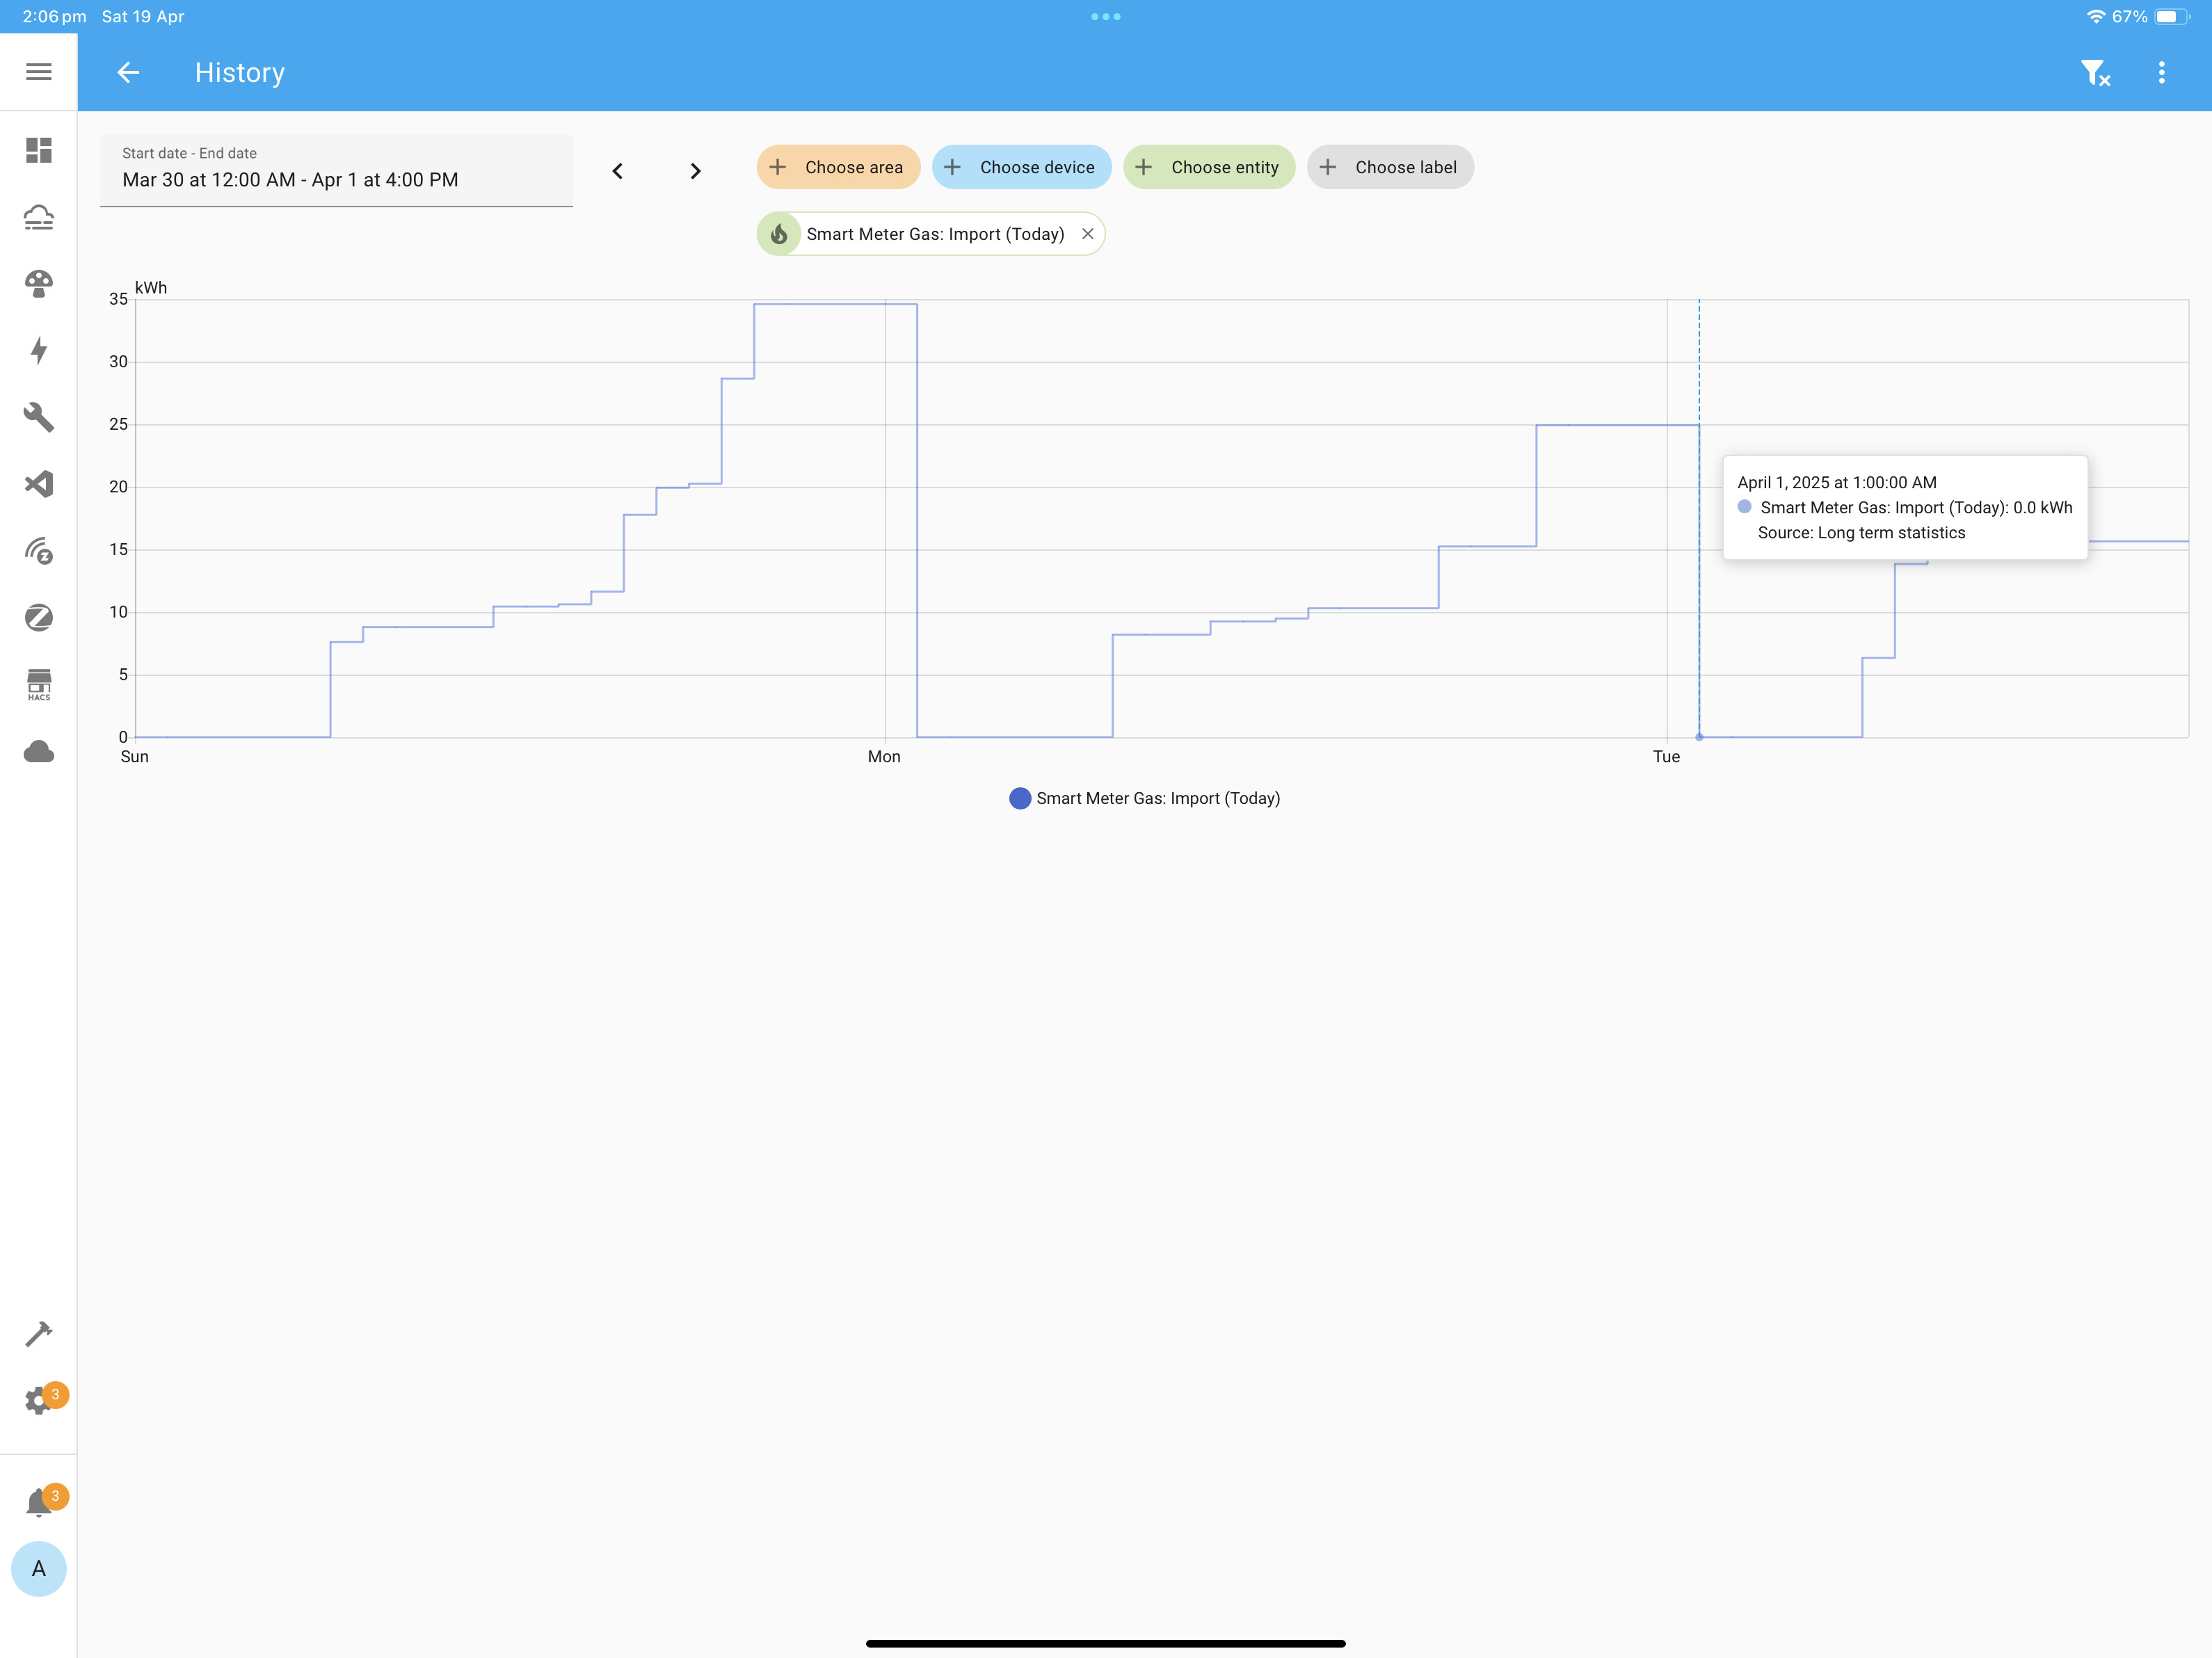
I have this crazy spike in the energy dashboard every night:

The sensor gives clean data:

The other day:

Where do I need to start troubleshooting this issue?

Ok so looks like your solar energy sensor resets to 0 at midnight, but HA is seeing it as energy usage by solar.

That means that HA is not aware of this midnignt reset and you need to create a utility meter helper using this sensor and set the cycle to daily. Then use this utility meter in your energy dashboard.

Will try thanks

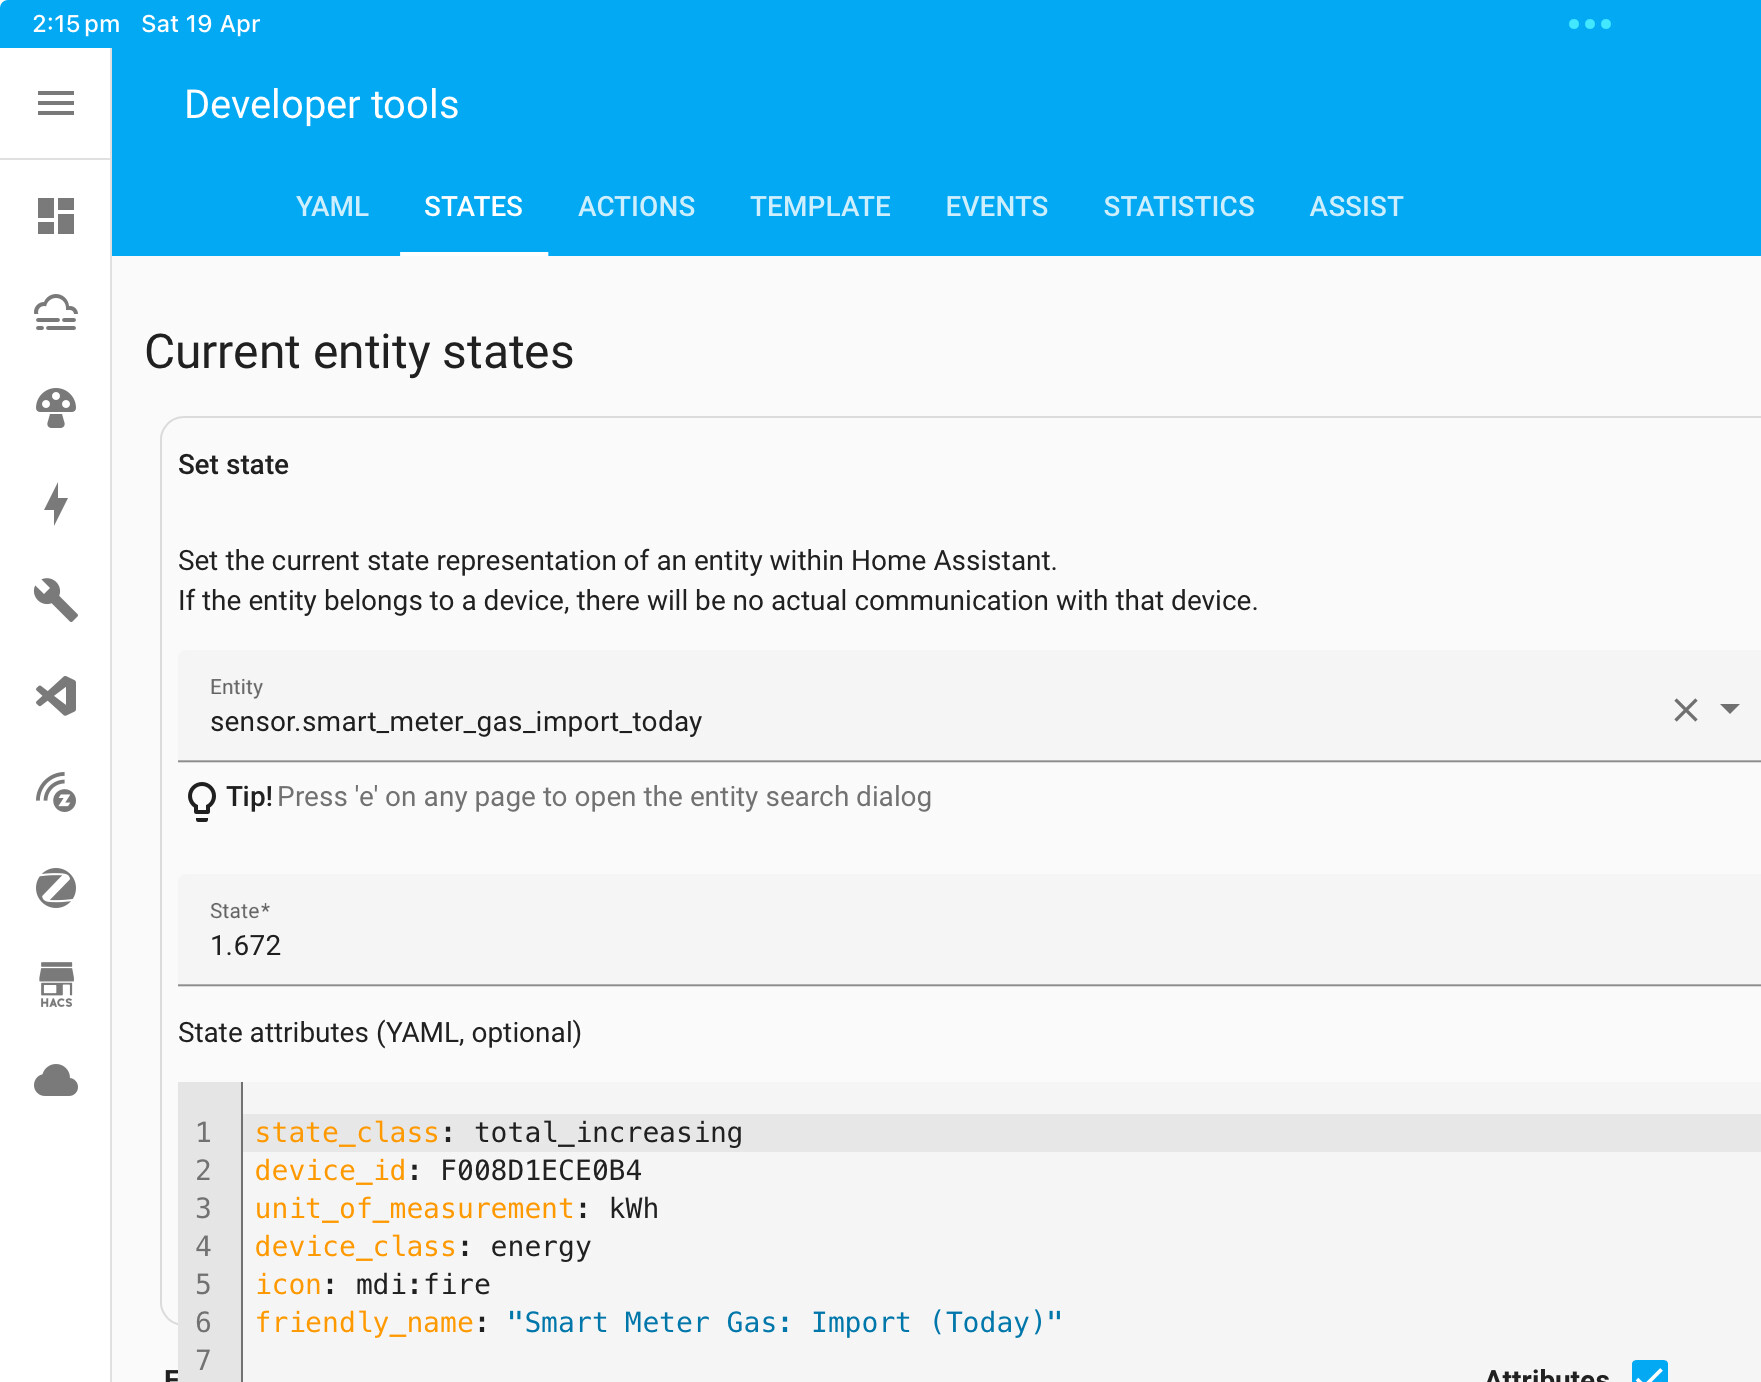
The utility meter will fix it, but the actual problem can also be fixed in the sensor itself by making sure the state_class is total_increasing and not total. With state class total a drop in the value is seen as production, with total_increasing it is seen as a meter reset. Utility meters have the right state_class, so that is why you can use it too.

I have the same issue but with my gas meter reading.

I have checked the sensor and its state_class is already total_increasing. Any other suggestions other than a utility meter?

The sensor seems to reset at 1am which my be causing my issue. Is a sensor from a Hildebrand Glow IHD smart meter

Pics attached.


If you have unexplained spike, please attach (or link to a codeshare paste):

  • Energy CSV download of that day
  • A history CSV download for a 3-hour period of the entity in question before/during/after the hour of interest.

A utility meter is generally not required for energy dashboard.

Note this data is too old that Mar 31 is no longer in your recorder. So your history graph is not showing the needed information (it is showing the long term statistics, not the raw history), so we can’t tell what happened there on march 31.

Do you have a more recent example from within your recorder retention period?

Sensor been doing this daily since 31st March. Have exported the requested data from yesterday and attached as requested. Thanks

Energy CSV: Apr 19 2:07 PM - Codeshare
Sensor CSV: Apr 19 2:09 PM - Codeshare

So for some reason this sensor is repeatedly bouncing between 0 and 4.186.

Each time the sensor goes from 4.1->0, that’s a reset, but each time it goes back to 0->4.1, that adds an additional 4.1 units to your consumption.

You’d have to investigate why it keeps bouncing like this.

sensor.smart_meter_gas_import_today,4.186,2025-04-18T22:00:00.000Z
sensor.smart_meter_gas_import_today,0.0,2025-04-18T23:00:28.521Z
sensor.smart_meter_gas_import_today,4.186,2025-04-18T23:11:58.764Z
sensor.smart_meter_gas_import_today,0.0,2025-04-18T23:12:28.352Z
sensor.smart_meter_gas_import_today,4.186,2025-04-18T23:41:58.591Z
sensor.smart_meter_gas_import_today,0.0,2025-04-19T00:11:58.434Z