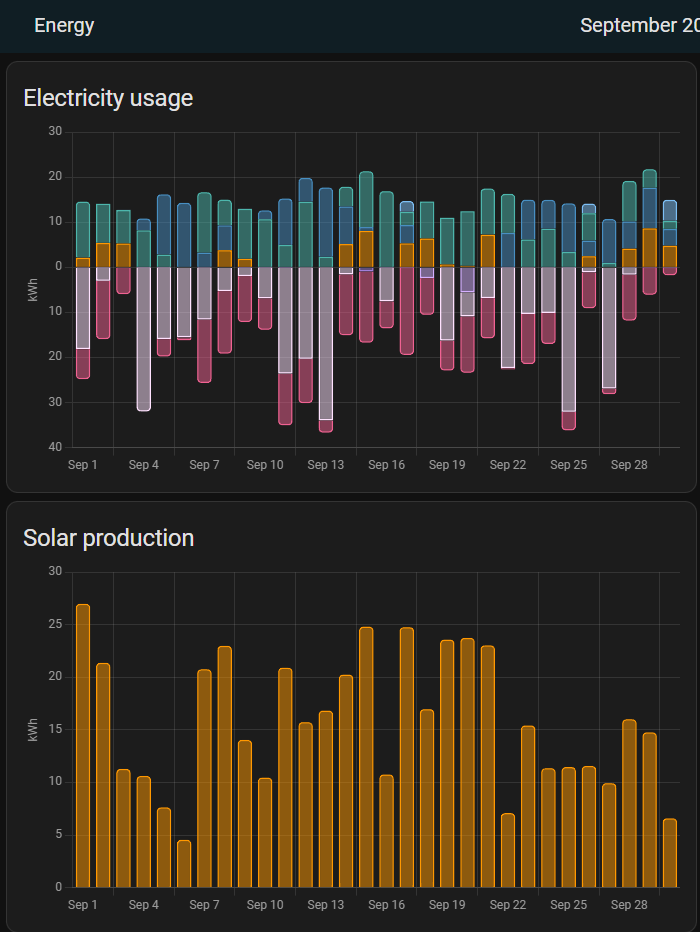
As you can see in the screenshot below, since august 2024 my solar usage disappeared from the monthly overview of the energy dashboard.
The sun was still shining and there should be a small orange bar in september and the months after that.
What could be the issue? I would like to resolve this so the months in the past give a correct “orange” bar.
(The light pink bars is my public EV-Charger; this way I can show the profits of my public charger - I doubt this is the issue since this worked before august 2024).
Thank you to anyone that can help me or send me in a correct direction…
Electricity usage is where your own consumed electricity comes from.
Looking at your graph, I understand that the EV charger used up all the Solar energy, so you were using grid (?) during those months for your own consumption.
I presume there is a minimal size to display log quantities. In November there is a 0.61 kWh on Peak hours return to grid visible.
When I count the orange bars together there should be 72.17 kWh of energy visible.
When I hoover over the september bar, there is no solar visible
I am not asking it here without trying to figure out first it is not something really dumb on my side.
-It will probably be something dumb, but not “really” dumb -
I think I am looking for some information to find out where the issue may be…
I think the Energy dashboard (and history) come from the statistics_short_term and statistics tables.
But which one? And are there separate records for each month, or does the energy dashboard calculates this from the daily (or hourly) statistics?
If I know this, I can look up in the data if everything is where it should be.
If it is not, I have an issue with the creation of data; if it is, I have an issue with reading the data. With that knowledge, I can go further in my “investigation”.
SELECT
	year(FROM_UNIXTIME(start_ts)) as jaar,
	month(FROM_UNIXTIME(start_ts)) as maand,
	max(sum) - min(sum) as stat
FROM statistics s
WHERE metadata_id = 302
GROUP BY
	year(FROM_UNIXTIME(start_ts)),
	month(FROM_UNIXTIME(start_ts))
ORDER BY 1, 2
I get this output
So there certainly is data there; The numbers don’t equal to the orange bars, but that is reasonable since the orange bars are “energy used directly”; you also have the battery charging and exporting to the grid. Since we see the total numbers in the database, I would presume this graph is calculated each time when accessing the energy dashboard.