Energy Dashboard showing bogus values

That’s ok. State class total_increasing can deal with that.

Your state template does not have defaults for your float conversion functions and the availability template might not have caught other non-numeric states so the template may have failed to load.

Using the float filter with a default is always recommended. e.g. (some_state)|float(0)

ah…

maybe that is why Summing up the Power and then building a Rieman Sum over it, seems to solve these issues…

But stilll… why does the Dashbord show a drop in Energy to Battery as an Increase in Solar production? Makes absolutely no sense to me.

1 Like

I don’t know. You have not shared the details of your solar production sensor.

The very first Screenshot in this post: Energy Dashboard showing bogus values - #4 by Zarox666

It did not drop, become unavailable, reset, jump or anything.
Its driven by a Riemann Sum:

Why are you using the Riemann sum if you have a Shelly EM3?

The Shelly has energy sensors already that you can use.

Here is your answer :slight_smile:

You can do those calculations with the energy sensors. No need to use the power and convert it to energy.

OK, enlighten me…
How do I get the correct values if the Shelly 3EM calculates Energy from-Grid and to-Grid seperately and independantly for all three phases?

But all this has nothing to do with the Question, why the Dashbord shows a reset of the Energy to Battery Sensor to 0 as increase in Solar Production.

So lets stay on topic please.
I am happy to discuss the need for the Calculations in the Thread for the Shelly 3EM.

It is because you do not have the correct sensors required for the energy dashboard.

What I have gathered so far is that you have a three phase system with solar connected to phase 1:

  • Shelly EM phase 1: grid phase 1 to house and solar production.

  • Shelly EM phase 2: grid phase 2 to house

  • Shelly EM phase 3: grid phase 2 to house

These are not enough to provide the energy dashboard with the information it requires.

Phase 2 and 3 are fine, they are just loads. You can use the Shelly energy sensors.

Phase 1 is the issue.

You have no way of knowing how much solar energy you are producing. As you only know the net energy (load - solar). Without knowing how much your load is on this phase you can not create a solar production sensor.

P1 = load - solar. This will go negative when you are exporting and you can use templates to create sensors that track net export and import. You can use the export sensor (when the value is negative) as the “return to grid” sensor in the energy dashboard. You can not use a template to to send the positive value from this to the energy dashboard “solar production” sensor.

What you actually have when this value is positive is still load - solar not solar production which is what the energy dashboard requires for its calculations.

You need another sensor. One that measures the energy coming from your PV inverter. Does not matter if this goes to your load or to the grid or any mix of the two, it just measures how much is being produced by your solar panels. Is your solar inverter smart enough to connect to Home Assistant and provide this?

If so, set the energy dashboard up like this:

  • You don’t need the Riemann sum sensor to split the positive and negative values on phase1.
    • Create a utility meter with two tarrifs, export and import. Feed it a template sensor from phase 1 that always returns a positive value (use the |abs filter).
    • Use an automation to switch the tariff depending on the phase 1 power being positive (import) or negative (export).
  • Utility meter import tariff → Energy Dashboard Grid Consumption sensor.
  • Shelly phase 2 energy → Energy Dashboard Grid Consumption sensor
  • Shelly phase 3 energy → Energy Dashboard Grid Consumption sensor
  • PV Inverter energy produced → Energy Dashboard Solar Production sensor
  • Utility meter export tariff → Energy Dashboard Return to grid sensor.

The Values for the PV Production come from a Shelly 1PM.
The value of sensor.pv_anlage_power is used with a left rieman sum named sensor.pv_energy_produced which is listed in the Dashbord as value for the solar production.

It behaves analog to the 2 Rieman Sums for Engery from Grid and Energy to Grid.
The Value for sensor.pv_energy_produced has remained constant on that day since the PV stopped producing.

But all this has been documented on your request in the Screenshots in my previous posts.

So I am really not sure why you are going on about the usage of the Shelly 3EM as Powermeter while the only problem is, that the Dashboard shows an increase of 2.5kWh in a single hour, while the underlaying sensor remained stable, and another completely unrelated Sensor (Energy to Battery) dropped to 0 (for a yet unknown reason).

And as you can see from the inital post, I am not the only one affected by this.

Just because other people make the same (or similar mistakes) does not make the way you have your sensors set up correct.

I tried to help. If you don’t want to be helped then good luck.

OK!
After the thread here was derailed, let me start from scratch and document the problem again.
Maybe someone who observes the same can speak up, or someone who understands how the Dashboard works can propose an explanation.

.
.
During the past months I had several occasions where the Energy Dashboard (and only the Dashboard) showed nonsense Values for a single hour.
In the first case I tried to fix the values stored in the Database and broke the DB in the process.
So I started over, but this time build my own counters which now proof (besides common sense) that what the Dashbord is telling is not only bogus, but also only affects the Dashboard.

The general Setup:
image
But I have this over several Versions since early december. Its essentialy a day-0 issue.

A Shelly 3EM provides Power Measurement for all 3 phases.
This Numbers are summed up and then split by a template Sensors into Power from Grid and Power to Grid.
For both Sensors exist left Rieman Sum Helpers, which provide the Energy Values used in the Dashbord for Energy to Grid and Energy from Grid.


Details on the Template Sensors see here: Shelly 3EM 3-phases Energy sensor - #166 by Zarox666

A Shelly 1PM measures the production of the Solar Panels, Its power value is also feed into a left Rieman Sum which in turn is listed in the Dashboard for the Production.

2 Shelly Plug S measure the power that goes into the UPS and into the Battery-Charger connected to the UPS Battery. Here the Energy values provided by the two Shellys are summed up in a template sensor and this is provided to the Dashboard as Energy to Battery.


A Shelly 1PM measures the output from the UPS and is used in the Dashbord directly.

.
.
Case 1: 15kWh into battery

The UPS is a 330VA APC with a 55Ah Battery. So the values are physicaly impossible.
The “UPS Energy Loss” Consumer is the Delta between “UPS Energy to Batttery” and “UPS Output”.
So if there would have been suddently 15kWh going into the battery, but only the normal 2.3kWh out of it, this would have exploded as well.
Here is the “UPS Energy to Battery” sensor for the day in question:

.
.
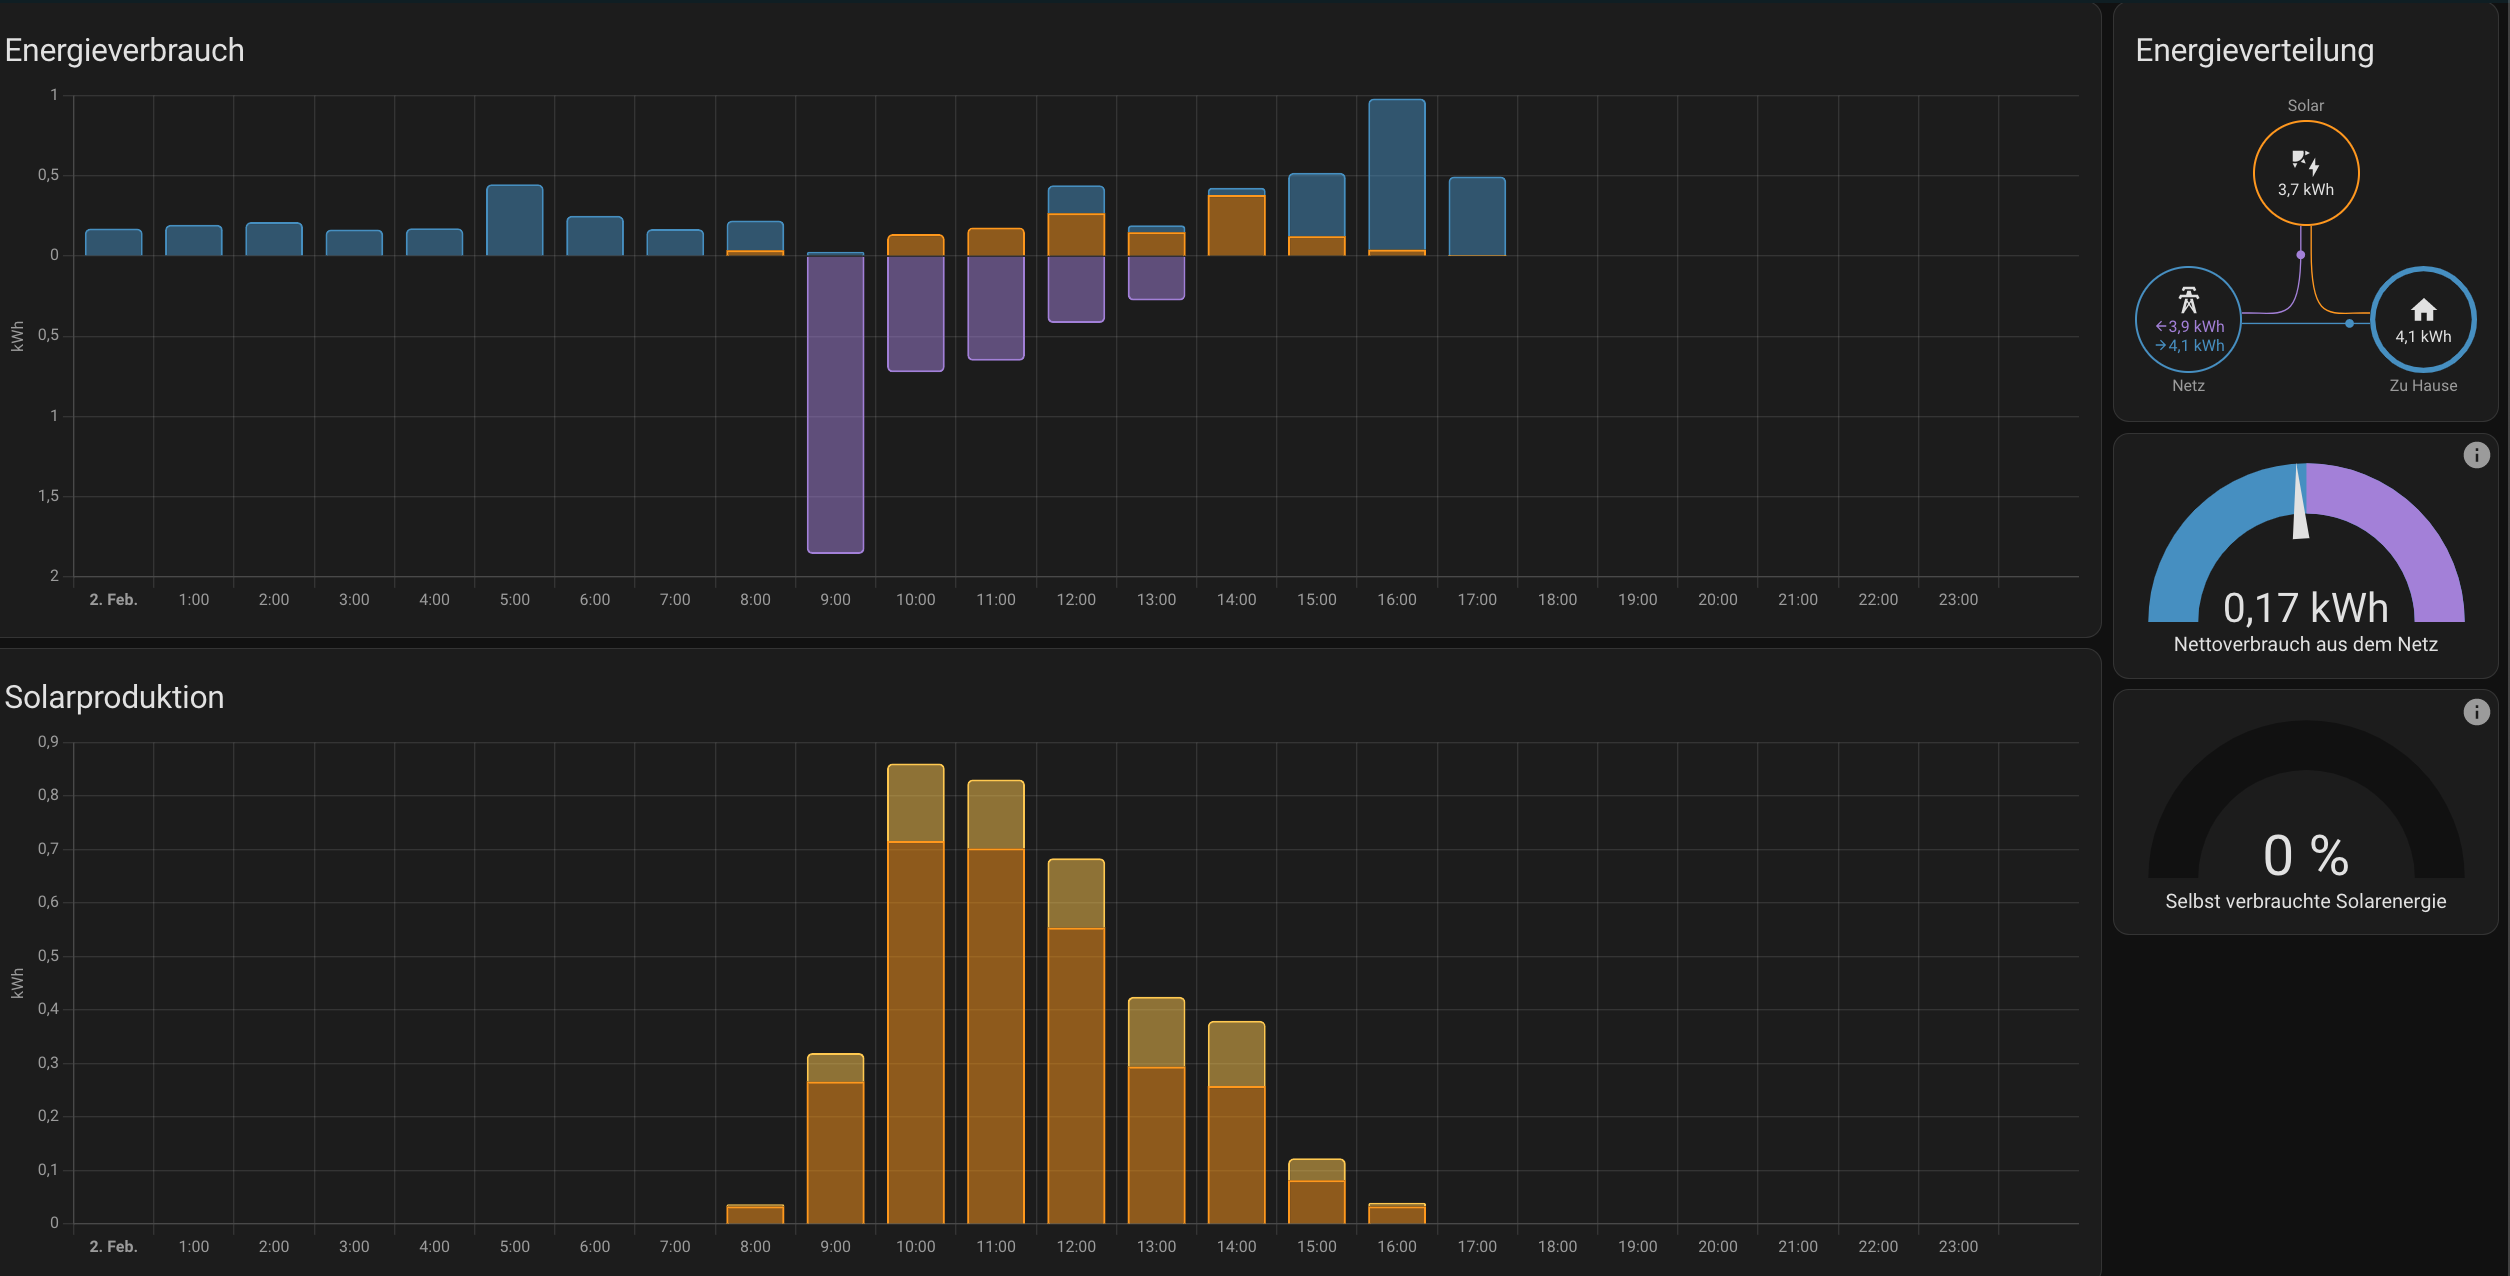
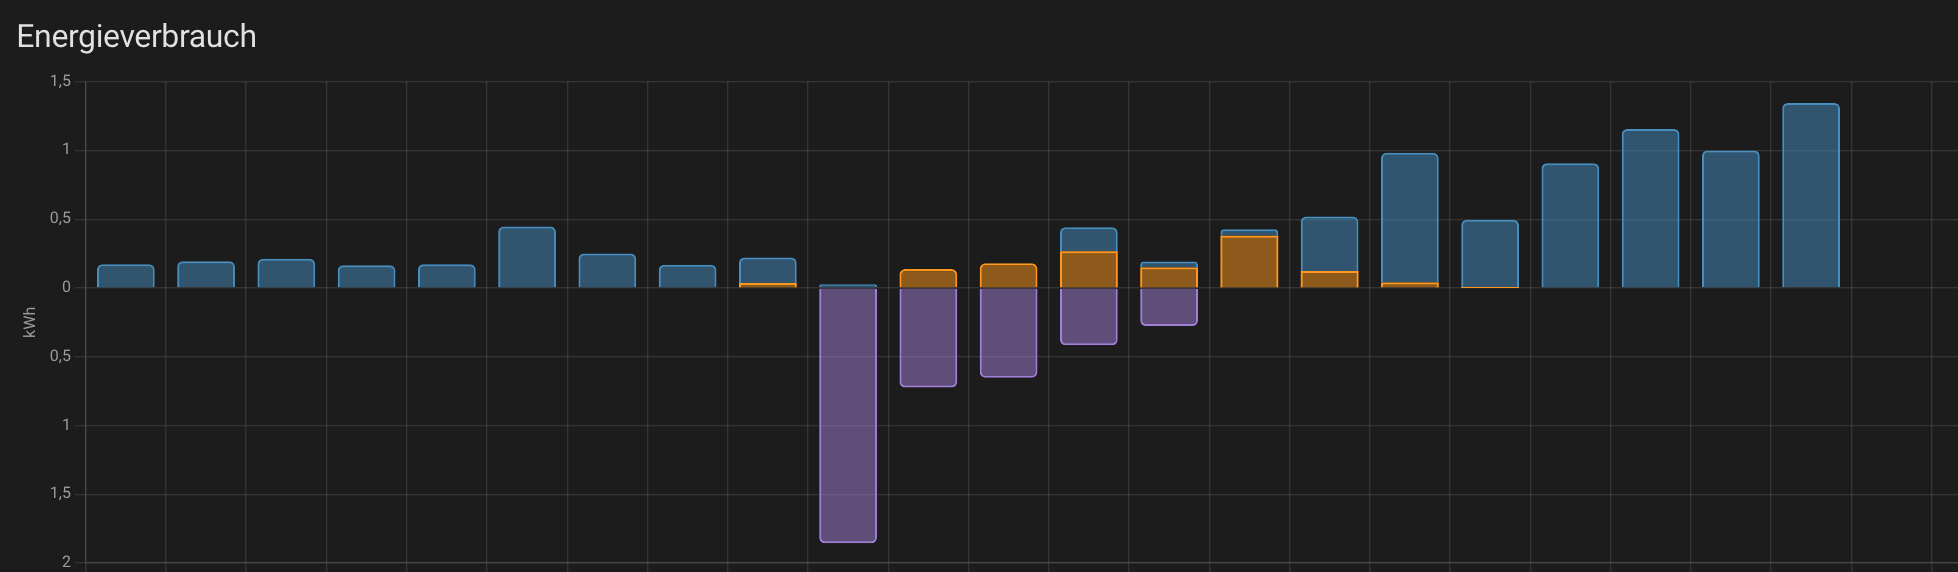
Case 2: 2.5kWh from Solar Panels during the night.

The corresponding Sensor during the interesting timeframe:

So where is that Solar Energy on the Dashboard coming from??

.
.
While Investigating I found something noteworthy in an completely unrelated Sensor but during the same hour.
The Energy Values of Both Shelly Plug S that measure what goes into the UPS have dropped to 0.
Hence the “UPS Energy to Battery” Sensor also dropped to 0 and started counting upwards from there again.

I have no clue yet why this happend but its a completly unrelated Measurement so it does not serve as an explanation what happend to the Solar production.

.
.
It seems
@fridayAr Shelly 3EM 3-phases Energy sensor - #176 by fridayAr
@Rachdingue Energy integration and utility meters

Are hitting simmilar / same? Issues. But they need to speek for their experiences and implementation details themself.

.
.
Any hints / clues / ideas on-topic are very welcome.

I still need to check everything that was written in this thread, hadn’t time for that yet, but if you are talking about random values which aren’t tracked by any sensor then, yes, I still have the same problem:

Did you change something from your solution, from the other thread?

I only changed the availablity check to is_number instead of the not ‘unavailable’ that I hade before as @tom_l correctly pointed out there are other non-numeric states.

This is a good suggestion but it wont work for germany. Our energy on every phase is calculated together before importing or exporting:
e.g.:
Phase 1 → 1000W
Phase 2 → -1200W
Phase 3 → 300W

100W imported NONE exported. Thats why you need to sum them. If you just check if Phase 2 is exporting and neglect to check the others you won’t get the correct value.

Can we please not derail this thread again?

The WHY the acumulation is required has been discussed in great detail in the thread about the Shelly 3EM so lets keep this thread about how and why the Dashbord shows stuff that is not seen in the corresponding Sensors.

I also wanted to reply to you but you were faster.

I think my problem is another then yours because in my case I can see a sudden increase in m energy exported:


So in my case it seems to be a configuration error, or is it the same?

I would guess that I used the wrong state_class but I somehow can’t get my head around the difference and when to use them

  # ---- Netz Total Power Summed ---- #
sensor:
  - name: "Netz Total Power"
    unit_of_measurement: "W"
    device_class: power
    state_class: measurement
    state: >
      {{ ([ states('sensor.shellyem3_channel_a_power'),
            states('sensor.shellyem3_channel_b_power'),
            states('sensor.shellyem3_channel_c_power') ]
            | map('float') | sum) | round(2) }}
    availability: >
      {{ states('sensor.shellyem3_channel_a_power')|is_number and 
      states('sensor.shellyem3_channel_b_power')|is_number and 
      states('sensor.shellyem3_channel_c_power')|is_number }}
  # ---- Netz Total Power Summed ---- #
  # ---- Add all PV which aren't monitored by the 3em ---- #
  - name: "Netz Total Power with pv"
    unit_of_measurement: "W"
    device_class: power
    state_class: measurement
    state: >
      {{ states('sensor.Netz_Total_Power') | float 
      - states('sensor.pv_east_side_energy_power') | float }}
    availability: >
      {{ states('sensor.Netz_Total_Power')|is_number and 
      states('sensor.pv_east_side_energy_power')|is_number }}
  # ---- Add all PV which aren't monitored by the 3em ---- #
  # ---- Netz Total Power Einspeisung ---- #
  - name: "Netz Total Power Returned"
    unit_of_measurement: "W"
    device_class: power
    state_class: measurement
    state: >
      {% if float(states('sensor.Netz_Total_Power_with_pv')) < 0 %}
      {{ 0 - float(states('sensor.Netz_Total_Power_with_pv'))}}
      {% else %}
      {{ 0 }}
      {% endif %}
    availability: >
      {{ states('sensor.Netz_Total_Power_with_pv')|is_number }}
  # ---- Netz Total Power Einspeisung ---- #
  # ---- Netz Total Power Verbrauch ---- #
  - name: "Netz Total Power Consumed"
    unit_of_measurement: "W"
    device_class: power
    state_class: measurement
    state: >
      {% if float(states('sensor.Netz_Total_Power_with_pv')) > 0 %}
      {{float(states('sensor.Netz_Total_Power_with_pv'))}}
      {% else %}
      {{ 0 }}
      {% endif %}
    availability: >
      {{ states('sensor.Netz_Total_Power_with_pv')|is_number }}
  # ---- Netz Total Power Verbrauch ---- #

I am having the Code Files open anyway. I will share them in the Shelly Post so you can compare.

Well it more or less seems to be the same. I honestly can’t tell what is wrong. I changed the availability check tonight, so I can’t tell if this will fix this problem in my case.

But I can’t tell what your problem could be. Your case seems to be even more confusing.

I honestly thing about getting a tasmota device just for reading the import and export data of my electricity provider meter device, just to get the data more easy. Other people don’t seem to have this problem.

Just so you know:
I didn’t get any strange values anymore, but I reworked my calculation according to this post:

I just used the new format. My values for export aren’t bogus anymore by using the utility_meter for daily and the is_number function.