I have configured home assistant with GivEnergy using GivTCP v3.0 using Youtube Tutorial - https://www.youtube.com/watch?v=rHSI4oTZyTI&t=3484s and all seems to work as expected except energy usage and energy flow charts mismatch with daily vs weekly figures.
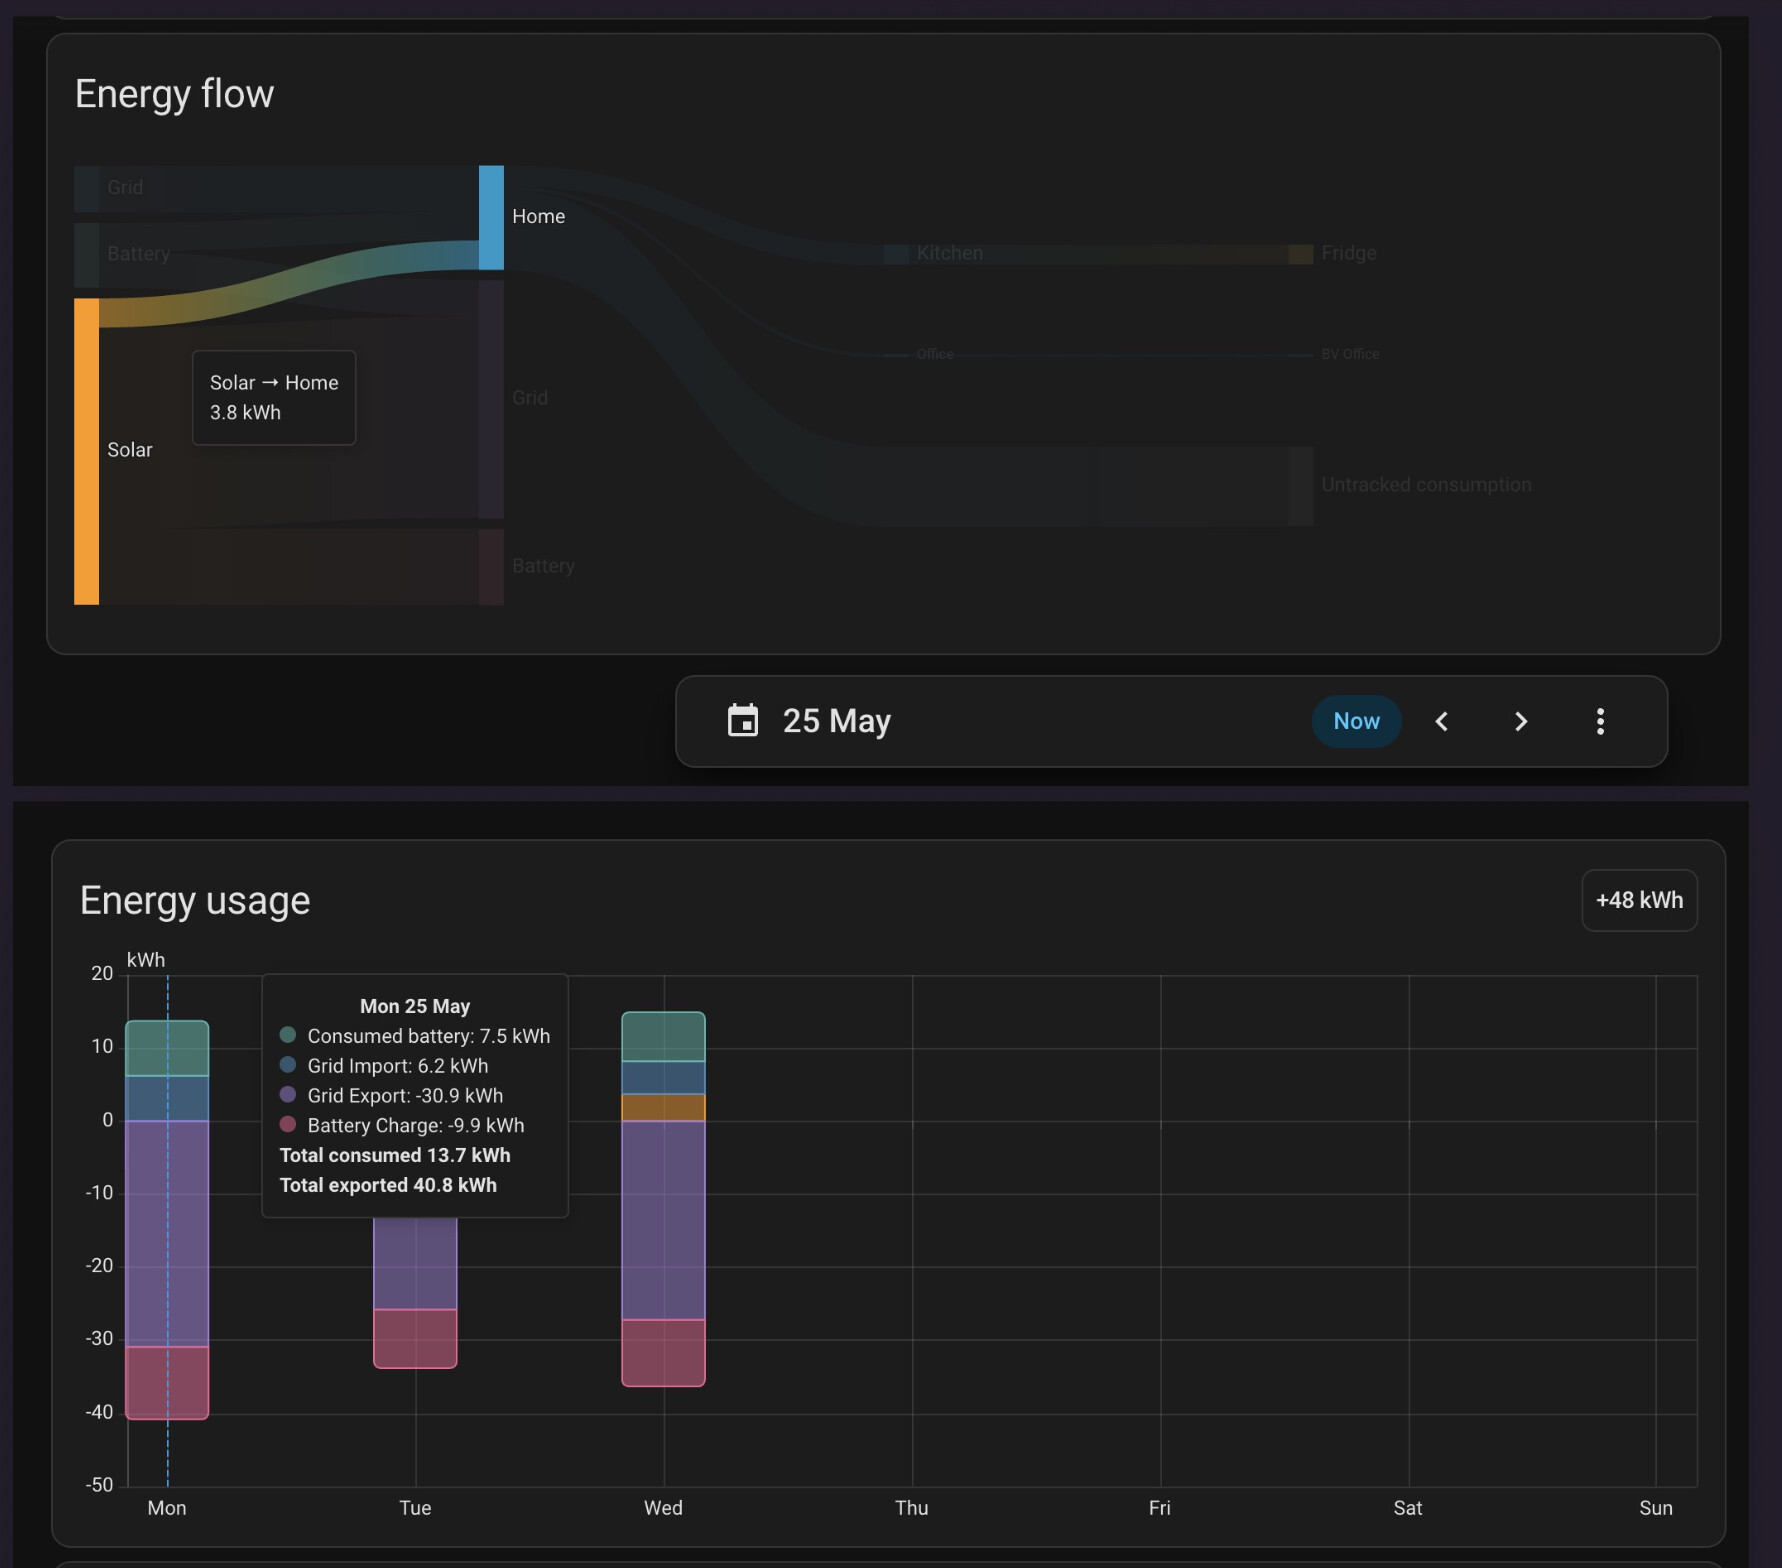
Energy Flow - Daily view - solar to home (consumed solar)
25 May 2026 : 3.8 Kwh
26 May 2026 : 6.5 Kwh
27 May 2026 : 6.7 Kwh
Total Consumed Solar : 17 Kwh
Energy Usage - Weekly View - solar to home (consumed solar)
25 May 2026 : 0 Kwh
26 May 2026 : 4.6 Kwh
27 May 2026 : 3.7 Kwh
Total Consumed Solar : 8.3 Kwh
The consumed solar 0 Kwh on 25 May seems to incorrect as i have used solar on that day. Please review attached image for 25 May - Energy Flow daily and Energy Usage weekly. The weekly chart I see no consumed solar but daily showing 3.8 Kwh used by home from solar generation.
Can you please advise how can i resolve this issue so weekly / monthly figures matches with daily ?
Please review below energy source config from diagnostic json file.
    "energy_sources": [
      {
        "type": "solar",
        "stat_energy_from": "sensor.givtcp_energy_energy_pv_generation_today",
        "config_entry_solar_forecast": null,
        "stat_rate": "sensor.givtcp_REDACTED_pv_power"
      },
      {
        "type": "battery",
        "stat_energy_from": "sensor.givtcp_energy_energy_battery_out_today",
        "stat_energy_to": "sensor.givtcp_energy_energy_battery_in_today",
        "power_config": {
          "stat_rate": "sensor.givtcp_REDACTED_battery_power"
        },
        "stat_rate": "sensor.givtcp_REDACTED_battery_power"
      },
      {
        "type": "grid",
        "stat_energy_from": "sensor.givtcp_energy_energy_imported_today",
        "stat_energy_to": "sensor.givtcp_energy_energy_exported_today",
        "stat_cost": null,
        "stat_compensation": null,
        "entity_energy_price": "sensor.octopus_energy_electricity_REDACTED_current_rate",
        "number_energy_price": null,
        "entity_energy_price_export": "sensor.octopus_energy_electricity_REDACTED_current_rate",
        "number_energy_price_export": null,
        "cost_adjustment_day": 0,
        "power_config": {
          "stat_rate_inverted": "sensor.givtcp_REDACTED_grid_power"
        },
        "stat_rate": "sensor.givtcp_REDACTED_grid_power_inverted"
      }
    ],
Regards
Bhavesh