Hi everyone!
I’ve been working on a new custom Lovelace card called Energy Horizon, and I’m excited to finally share it with the community for some early testing.
What is Energy Horizon?
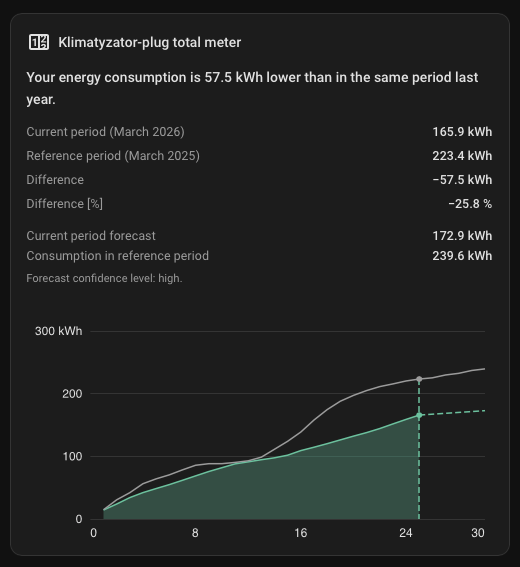
Most energy cards focus on live power or daily usage. Energy Horizon is different—it’s designed specifically for long-term statistics. It helps you visualize how your cumulative energy consumption is trending compared to a historical period (e.g., this year vs. last year).
Key Features:
 Cumulative Comparison: Compare current usage against a reference period (Year-over-Year or Month-over-Year).
 Smart Forecast: Automatically estimates your total for the current period based on historical progress.
 Visual Summaries: Includes numeric summaries (current, reference, difference, and percentage) and localized trend text.
 Visual Editor: Full support for the UI editor—no need to dive into YAML for basic setup.
 Unit Scaling: Automatically scales Wh to kWh/MWh or allows you to force a specific prefix.
 Early Access / Beta Notice
Please keep in mind that this is currently an early access, raw version. While it is functional, there may be bugs, and it requires your entities to have solid long-term statistics enabled.
Note on Design: I am currently in the middle of a major visual redesign of the card to make it even cleaner and more integrated with the modern HA look. Expect the UI to evolve significantly in the coming weeks!
How to install
The card is HACS-ready! You can add it as a custom repository: https://github.com/hello-sebastian/energy-horizon
Feedback Wanted!
I would love for you to give it a spin. Does it work with your data? Is the forecast accurate for your use case? What features are missing?
Please feel free to leave feedback here or open an issue on GitHub. Your input is what will help make this card stable and useful for everyone.
Thanks for checking it out!