Energy Integration Spike

I just set up the new Energy Dashboard using IotAWatt an the Integration sensor. I noticed a huge spike yesterday that appears false, so I’m trying to figure out what caused and how to prevent.

Energy Dashboard showing 40.38kwh usage at 7am (from sensor.import_wh_calculated)
energy-usage

When I look at the history for sensor.import_wh_calculated around the same time, I see a 3kwh drop, then it flatlines (which is expected when solar production kicks in)


Where does this usage spike come from?

sensor.import_wh_calculated is defined like this:

platform: integration
source: sensor.import
name: import_wh_calculated
unit_prefix: k
round: 2

sensor.import (from IotAWatt) doesnt even show a spike at that time

1 Like

I just found this GitHub issue about a similar problem, and am wondering if this is because of a HASS restart? I did restart today, however, and don’t see a similar spike… but import was 0 at the time.

For a template sensor, you can check availability of the sensor… but not sure how to do this with the Integration. Does that need a code update to be used by the Energy dashboard?

Try to check for the availability of your energy sensors.

This is an example code:

total_solar_energy:
        value_template: "{{ ( states('sensor.total_yield')|float 
        + states('sensor.total_yield_2')|float )  | round(2)
        }}"
        availability_template: "{{ states('sensor.total_yield') not in ['unavailable', 'unknown', 'Unknown', 'none']
        and states('sensor.total_yield_2') not in ['unavailable', 'unknown', 'Unknown', 'none'] }}"
        device_class: 'energy'
        unit_of_measurement: 'kWh'

hope it helps

1 Like

I have the same issue, it does not appear to be related to restarts or sensor values.

I have several examples of this and the underlying energy is not showing any tract of this additional energy.

My energy provider also provides 30min power usage on their app and it also does NOT show any significant consumption around this time?

Screen Shot 2021-10-12 at 9.10.28 am

1 Like

Add another to the list … Almost everyday it gets ruined by a spike.

And it doesn’t show up on the inverter’s monitoring site:

Not sure if what I mention below helps any but thought it worth mentioning.

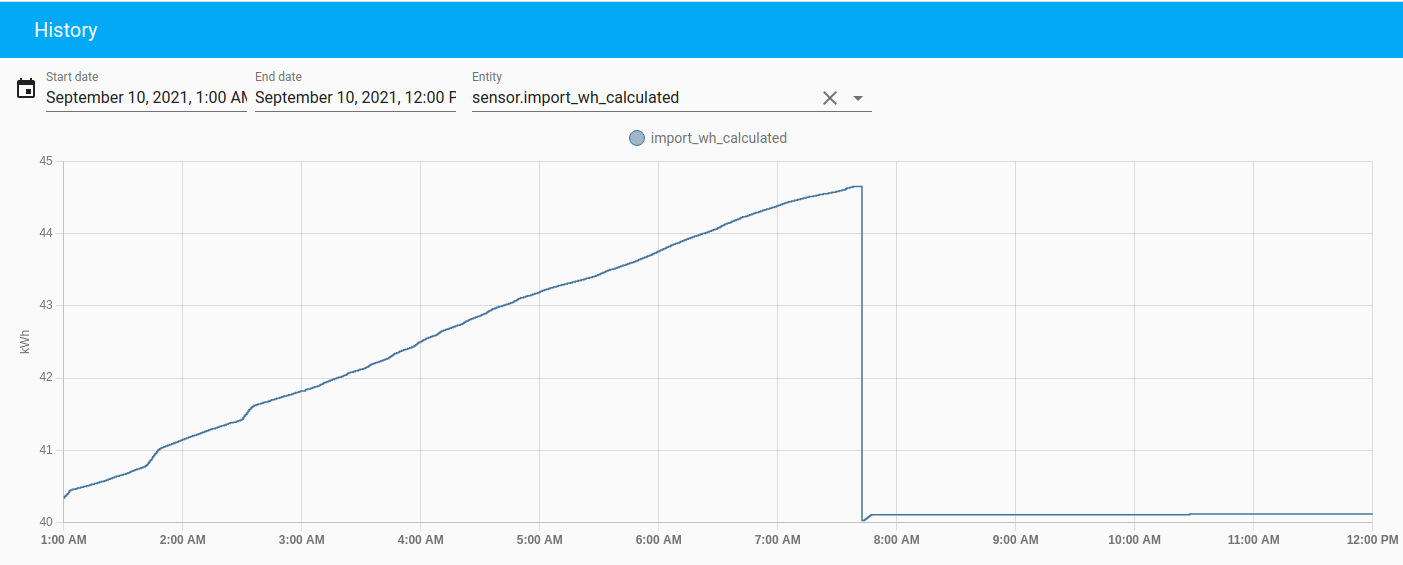
I had a similar issue with my energy dashboard and a zigbee pulse meter. If for whatever reason the zigbee network has a moment, the (custom) sensor (based on the Zigbee pulse meter) I am using to track energy usage would drop to zero briefly and when it came back to life, the dashboard has recorded a massive spike in energy usage - the difference between 0 and the (now working again) figure from the sensor.

For example, if my cumulative figure from the sensor was 1000, the zigbee network wobbles, sensor goes to zero, zigbee comes back seconds later, the sensor reports 1000 again, I’ve apparently used 1000kWh in that space of time.

I am not certain but it could be related to the fact that in my case, I’ve had to create a custom sensor myself based on the input data from the Zigbee pulse meter rather than the pulse meter’s actual data itself. (In my case, the Zigbee pulse meter uses a hard-coded 1000 impulses per kWh but my actual energy meter uses 4000 pulses per kWh)

To do that, I have this in my config - this is the sensor I add to the energy dashboard’s config:

template:
  - sensor:
      - name: "Home Energy Consumption"
        state: "{{ states('sensor.home_power_consumption') | float / 40 }}"
        unit_of_measurement: "kWh"
        icon: mdi:flash
        state_class: total_increasing
        unique_id: "home_energy_consumption"
        device_class: "energy"

I think the problem for me at least was that as mentioned above, the custom sensor goes to zero (rather than unavailable) before returning to normal.

To fix that, I read that adding an availability: section to the sensor would prevent it recording zero. Unfortunately I don’t recall who suggested this (kudos goes to them).

As such, I ended up with this instead (adding the rounding for my own benefit) but the availability section seems to have fixed matters as it hasn’t happened again since:

template:
  - sensor:
      - name: "Home Energy Consumption"
        state: "{{ states('sensor.home_power_consumption') | float / 40 | round(5)  }}"
        unit_of_measurement: "kWh"
        icon: mdi:flash
        state_class: total_increasing
        unique_id: "home_energy_consumption"
        device_class: "energy"
        availability: "{{ states('sensor.home_power_consumption') | int(default=-100000) > -100000 }}"
1 Like

I’m the IoTaWatt developer. Suffice to say that the current integration is not under my control.

There is a new release of IoTaWatt firmware coming out soon that will track solar import and export in the IoTaWatt and make integration simple. It will require using a HACS integration.

The current maintainer of the official version has a pre-release and may modify the current release version to work better. He has reported a similar problems with the current version to me.

I am testing with the original 0.0.8 HACS version. It seems to do all that is needed. I’ll post back here as the new version gets closer to release in a week or two.

I’m experiencing the same problem. Measuring the grid energy input using Aeotec Home Energy Meter. I’m seeing unrealistic spikes in the energy dashboard (eg, 200 kWh consumption today instead of about 10 kWh, which would be the correct value). Strangely the Home Energy Meter’s energy consumption sensor shows the correct value (10 kWh), so no idea how Home Assistant got the bad value. If I remove the Home Energy Meter from the grid input sources, the spike disappears from the Energy dashboard, but if I add back the Home Energy meter to the list of grid input sources, the spike comes back.

Any idea how to prevent the spikes and how to remove the incorrect spikes from the Home Assistant DB?

Thanks!

I tried using SQLite web to delete all entries from the statistics table which had the spiked sum value coming from the Aeotec Home Energy Meter. The deletion was a success, but the next hour Home Assistant started registering spiked values into the DB (into the statistics table) again. I can’t understand where it’s taking that spiked value from, since I’ve deleted it all from the DB and the source meter (the Aeotec Home Energy Meter) is showing a normal energy consumption value. Is Home Assistant storing these values in some other place too? If yes, where? How is it really calculating the sum value in the statistics table?

By the way, years ago I was using Domoticz for home automation. That one had a functionality to shift-click spikes on graphs and delete them easily. would be great to have that in HA too, since apparently some sensors sometime malfunction and generate unwanted spikes.

Looks like the data also has to be fixed in the statistics_short_term table.

i have a very similar Issue, how did you delete the spikes?

You have to use the SQLite add-on and delete data from the statistics and statistics_short_term tables using SQL statements.

First you have to find the metadata id of the device which is causing spikes. You can do this by looking at the contents of the metadata table in SQLite. Then, once you have that ID, let’s assume it’s 100, you can issue statements like this:

SELECT *
FROM "statistics"
where metadata_id=100

SELECT *
FROM "statistics_hort_term"
where metadata_id=100

DELETE
FROM "statistics"
WHERE metadata_id=100 AND "sum" > 12345

UPDATE "statistics"
SET sum = sum - 35
WHERE metadata_id = 100 AND sum > 12345

You’ll obviously have to figure out on your own which are the criteria for the data that you want to update or delete in those tables.

ok, thanks! I am already looking into it!

1 Like

prefect, thank you very much, all clean and spikes are gone :partying_face:

1 Like

I get these darn spikes at least twice a week and it’s quite annoying having to clean them up frequently through SQLite Web… I wish Home Assistant would detect and filter out energy readings which are disproportionately high or I wish we could configure it to ignore readings which are larger than the previous reading by X amount or by Y percent.

Anyway, cleaning up the bad data from the “statistics” and statistics_short_term" tables does not seem to also clean up the energy cost (price) shown on the energy dashboard. The price/cost remains huge, reflecting the spikes. Any one know where the price/cost is stored and how it can be cleaned up?

1 Like

Plus one for spikes. On the daily. Is there a feature request section we can all vote for?

1 Like

Happy to hear I’m not the only one, would love to know how to stop having to manually correct these spikes. There’s no invalid or undefined data, it just suddenly decides to add a big amount to one of the total measurements. What data would be needed for this to be looked at? Is there any open issue or indeed feature request to bundle efforts?

From what I can tell it appears as if the state is being added to the sum instead of the difference between the previous state and the current one.

Are you using a template sensor for your kWh sensor? Or is there a template sensor in your configuration that ultimately generates your kWh sensor?

The price/cost is configured on the “http(s)://your-link-to-homeassistant/config/energy”, but can be retrieved in the database via the states table (you’ll have to fetch only the latest value, it can have multiple records). It’s a sensor with as entity_id the name of your input with added “_cost”. F.i. if you’d have called the input “Total Day Usage” then it would be called “sensor.total_day_usage_cost” this was incorrect, I quickly searched through states and came out on the resets which mapped the base price

it gets its information through mqtt, I tried using a template to prevent spikes by specifying outliers but that in the end did not help my case at least.