The energy dashboard is just a default view. You can recreate it and add whatever you wish. Energy Cards - Home Assistant
1 Like
How can I delete obsolete devices and grid-setting from the energy dashboard?
Add new ones are simple enough, but after moving to a new home, most of my devices as well as the main consumption and cost sensors have got new names, and I cannot figure out how to delete them. There is nothing in my configuration YAML
Help please, anyone ?
I set up the Energy Monitor using a shelly EM3, and (so far at least) the energy data and graphs match what I can see on the display of my inverter and the web server of the EM3. Now I want to track costs which, with my utility provider, involves a daily charge plus two different kWh charges, one peak-hours and the other off-peak. After reading the docs and this thread, it is unclear to me whether I must use the utility meter integration to supply the correct kWh value to the monitor, or whether a sensor template can do that. Could I get some guidance in the simplest method of an entity that would send the correct kWh value to the monitor? Thanks for any help.
Dear community.
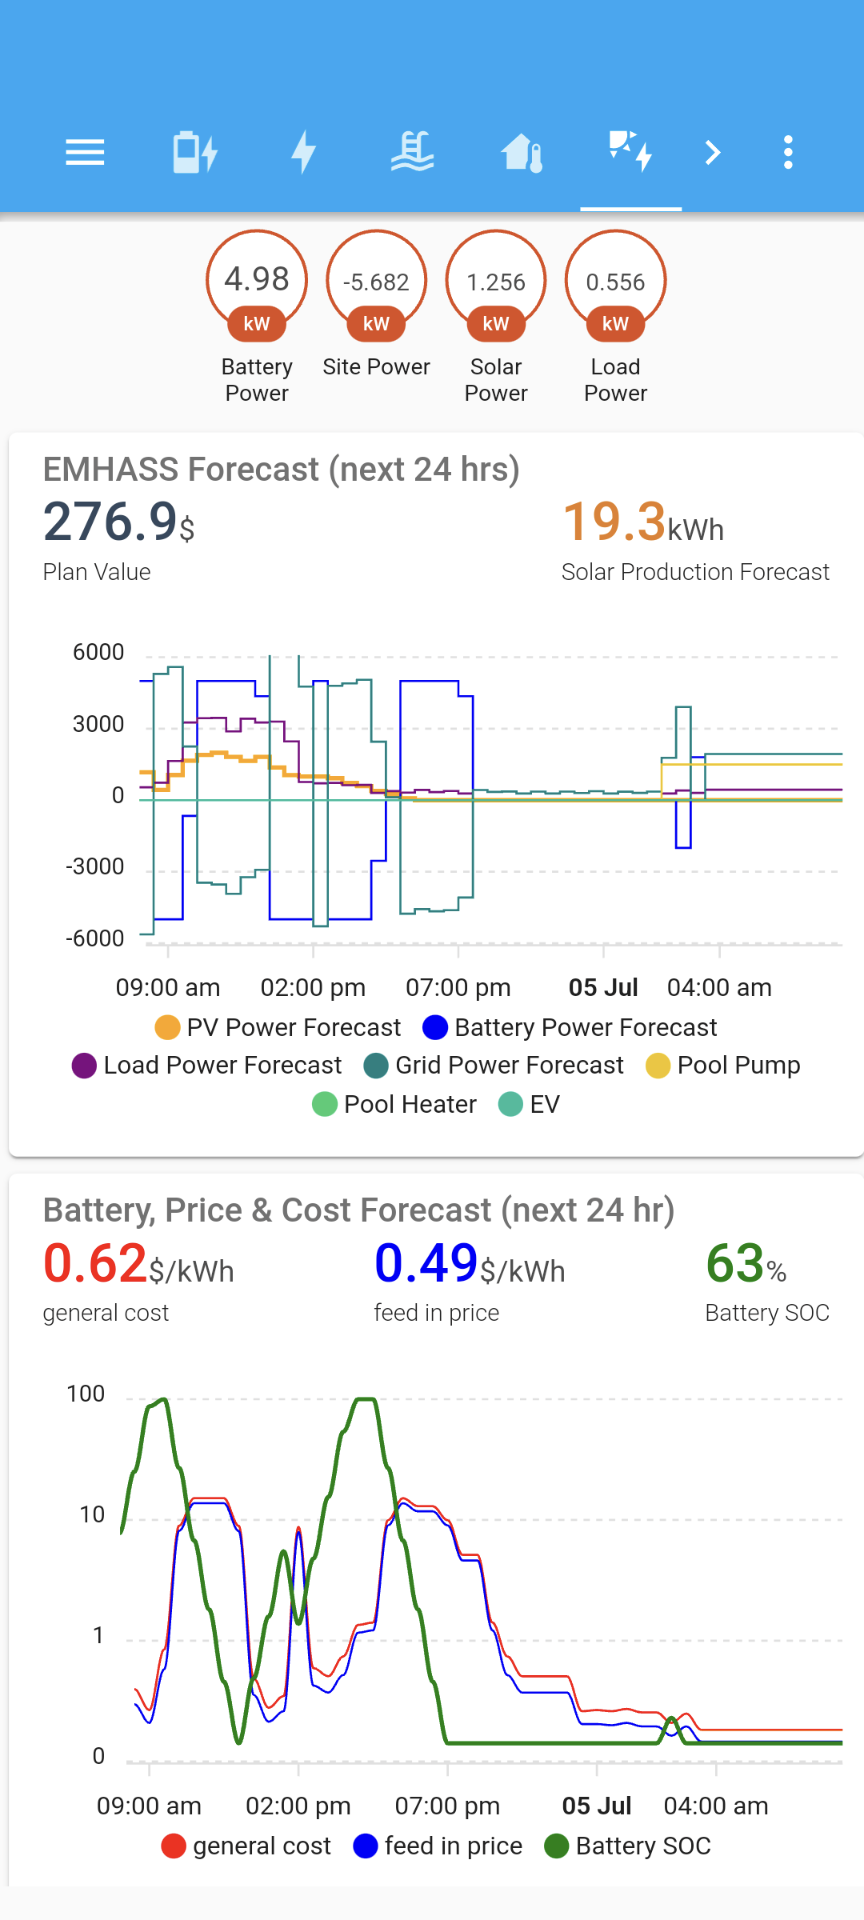
I’m looking for help on this one. I need to extract the data from the dashed black curve shown in this graph below. I need to use this data in a template. This is the solar PV production forecast from the Forecast.Solar integration as shown when added to the Energy Management dashboard:

Any help on this will be much appreciated.
Oddly the data from the energy dashboard isn’t easily reusable in other templates and the like.
I use Solcast Global Solar Power Forecast Integration for my forecasting in the energy dashboard, but have ended up getting the data I need with a REST sensor.
- platform: rest
  name: "Solcast Forecast Data"
  json_attributes:
    - forecasts
  resource: https://api.solcast.com.au/rooftop_sites/yyyy/forecasts?format=json&api_key=xxx&hours=24
  method: GET
  value_template: "{{ (value_json.forecasts[0].pv_estimate)|round(2) }}"
  unit_of_measurement: "kW"
  device_class: power
  scan_interval: 8000
  force_update: true
    - name: solcast 24hrs forecast
      state: >-
          {%- set awattar_all_list = state_attr('sensor.solcast_forecast_data', 'forecasts') | map(attribute='pv_estimate') | list %}
          {%- set values_all = namespace(all=[]) %}
          {% for i in range(awattar_all_list | length) %}
           {%- set v = (awattar_all_list[i] | float |multiply(1000) ) | int(0) %}
            {%- set values_all.all = values_all.all + [ v ] %}
          {%- endfor %} {{ ([states('sensor.APF_Generation_Entity')|int(0)] + values_all.all)[:48] }}
sensor.solcast_24hrs_forecast
solcast 24hrs forecast
[955, 0, 27, 122, 255, 567, 1038, 1437, 2069, 2441, 2461, 2259, 1817, 1371, 1053, 996, 997, 923, 727, 589, 393, 260, 81, 0, 0, 0, 0, 0, 0, 0, 0, 0, 0, 0, 0, 0, 0, 0, 0, 0, 0, 0, 0, 0, 0, 0, 0, 0]
I use this in EMHASS: An Energy Management for Home Assistant as follows:
    post_mpc_optim_solcast: "curl -i -H \"Content-Type: application/json\" -X POST -d '{\"load_cost_forecast\":{{(
          ([states('sensor.amber_general_price')|float(0)] +
          state_attr('sensor.amber_general_forecast', 'forecasts') |map(attribute='per_kwh')|list)[:48])
          }}, \"prod_price_forecast\":{{(
          ([states('sensor.amber_feed_in_price')|float(0)] +
          state_attr('sensor.amber_feed_in_forecast', 'forecasts')|map(attribute='per_kwh')|list)[:48])
          }}, \"pv_power_forecast\":{{states('sensor.solcast_24hrs_forecast')
          }}, \"prediction_horizon\":{{min(48,
          (state_attr('sensor.amber_feed_in_forecast', 'forecasts')|map(attribute='per_kwh')|list|length)+1)
          }},\"soc_init\":{{(states('sensor.powerwall_charge')|float(0))/100
          }},\"soc_final\":0.05,\"def_total_hours\":[2,0,0,0]}' http://localhost:5000/action/naive-mpc-optim"
2 Likes
Excelent, exactly what I was looking for 

Hello, great work!
can you help me understand why my “Solar Feed” variable is not shown on the combobox of “return to grid?”
i have my energy net sensor (the difference between production of solar and consumed):
- sensor:
- name: “energy_net”
friendly_name: “energy_net”
unit_of_measurement: W
#value_template: "{{(states(‘sensor.shelly_shem_485519c9f87b_2_current_consumption’) | float(0) - states(‘energy_shelly3em_total’) | float(0)) | round (2) }} "
state: “{{ ( states(‘sensor.shelly_shem_485519c9f87b_2_current_consumption’) | float) - ( states(‘sensor.shelly_shem_485519c9f87b_1_current_consumption’) | float) }}”
state_class: measurement
device_class: power
- name: “energy_net”
but i don’t see “energy_net” on combobox:

any help will be appreciated please!
It’s a ‘power’ sensor and not an ‘energy’ sensor, and its type must be total_increasing. There are many examples on the forum of how to build a template sensor of this type, search for them 
The Energy Dashboard works off of kwH (energy) and not kW (power) sensors.
Thank you, it was the last test, i read lots of post but i’m sure i’m doing something wrong.
I’ve also tried to set total_increasing and energy class, like this:

i read also the post where explain how to convert W to KWh, and i did it i think correctly- But i don’t see my sensor in energy dashboard.
Any suggestion?
I am struggling to understand the following. I have a Shelly EM with 2 clamps (as I have two meters) each of them is reading and incrementing the sensor normally. I have another template sensor I defined to add them together, but that is behaving rather oddly as follows:

So it seems like there is something wrong which is causing the stairstep graph of the total. That sensor is defines as follows:
      daily_energy:
        friendly_name: Daily Energy
        device_class: energy
        unit_of_measurement: kWh
        value_template: "{{( (states('sensor.daily_energy_timed') | float + states('sensor.daily_energy_normal') | float) | round(0)) }}"
        availability_template: "{{ (states('sensor.daily_energy_timed')  not in ['unknown', 'unavailable']) and (states('sensor.daily_energy_normal')  not in ['unknown', 'unavailable']) }}"
The utility meter is defined as follows:
utility_meter:
  daily_energy_normal:
    source: sensor.shelly_em_channel_2_energy
    name: Daily Energy Normal
    cycle: daily
  daily_energy_timed:
    source: sensor.shelly_em_channel_1_energy
    name: Daily Energy Timed
    cycle: daily
  monthly_energy_normal:
    source: sensor.shelly_em_channel_2_energy
    name: Monthly Energy Normal
    cycle: monthly
  monthly_energy_timed:
    source: sensor.shelly_em_channel_1_energy
    name: Monthly Energy Timed
    cycle: monthly
Does anyone know what I have done wrong?
Thanks!
With the | round(0) in your template you get only total kWh’s, remove it…
If I’m right the Shelly EM can only measure one phase (the one where it gets power from). If you have two meters with three phases each don’t you need 2x Shelly EM3?
I knew it had to be something simple! Many thanks…
We don’t normally have 3 phases here in the UK and I’m using the Shelly EM
How to get the self consumed working, plus the forecast line in solar productions?
There is no way I can get those working, I added the forecast entity in my HA but it will nto show.
And well I scrape the sma values now from the portal for webdev does not work either here but how to get those readings to work with self consumed?
Thank you
I have the Shelly EM3 , three phases from the distributor , all working well in the Shelly App’s and HA. The Energy Dashboard shows all the bars in the “Energy Usage” bar charts in various shades of Blue. My 3 Phases are Red , Yellow and Blue. How do I change the colors in the graph ? Will look better !!
How can i pass data from IEC62056 so it is readable in energy dashboard? Anycookbook for that or easiest would be to look how P1 integration does it?
Excuse the question, but where does this have to go
template:
- sensor:
In the configuration.yaml?
Do I understand correctly that I name my sensors in MQTT and insert them in this template?
The energy dashboard is great, but one feature that I am really missing is my actual electricity cost/kWh.
Let me explain. I am on an hourly tariff. As setup in the dashboard, I get the horly, daily … costs.
All good.
But as I am trying to “save” as much as possible, I do obviously charge my EV during “low price” periods.
Since the EV consumption is the biggest consumer for my house, my accumulated cost (per time interval) is vastly lower than the average price (per time interval).
That is, I use a lot of electricity when it is cheap, and try to use as little as possible when expensive.
The calculation is (obviusly) simple, acumulated cost/accumulated energy usage. When comparing this to the “price”, it’s really rewarding ; -).
Currently I am migrating from “the other” HA system. There I have this set up by some rules. But shouldn’t this already be a feature of the energy dashboard?, that is cost/kWh
Also, a final query. Is it possible to access the “cost” entity that is already presented in the energy dashboard? It seems silly that I should setup rules for this, since it is obvisously already “in the system”
