Have a look here where I posted one solution to this general problem Energy Management in Home Assistant - #891 by OzGav
Is it possible to use this somehow to see your current energy consumption and history but for regular devices like hue lights, TV devices etc…
Similar to how it works in homey.
1 Like
Hi
very nice feature, but on my hassio it seems to be a bit random. I’ve integrated a few of my Tuya SmartPlugs and my UPS (CP1500EPFCLCD by CPS), but the UPS graphs are showing funny data. I have a pretty much unchanged use of my computer (I know, I shoud get out more…), and the energy meters show some pretty random data. It should show about the same consumption for the last 3 months, but it doesn’t. Even the costs are calculated wrong, it shows a bigger sum on lower consumption, see pics.
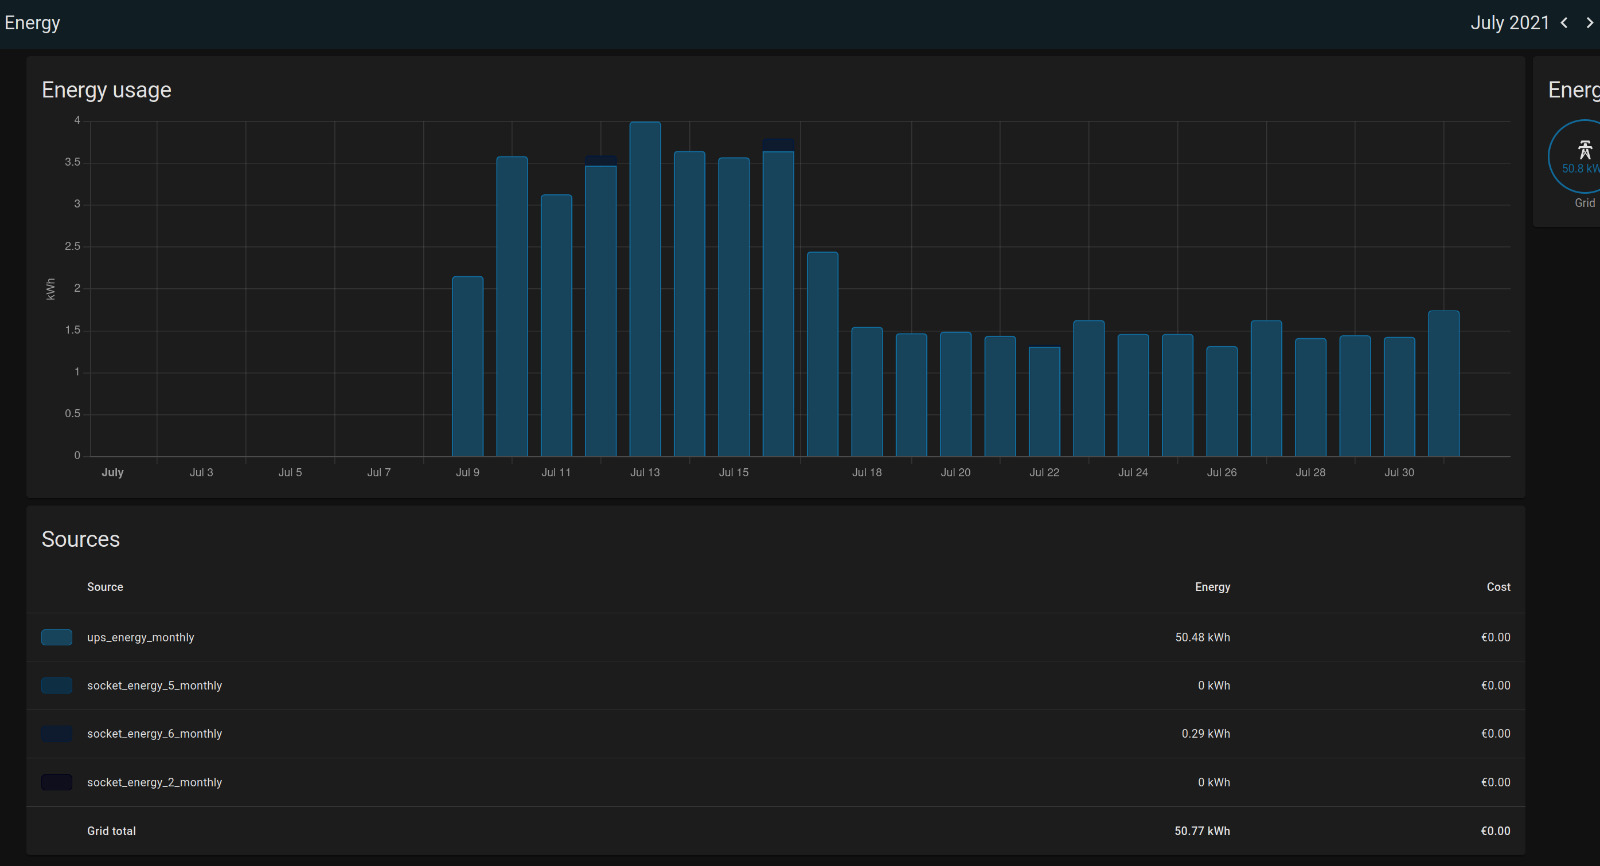
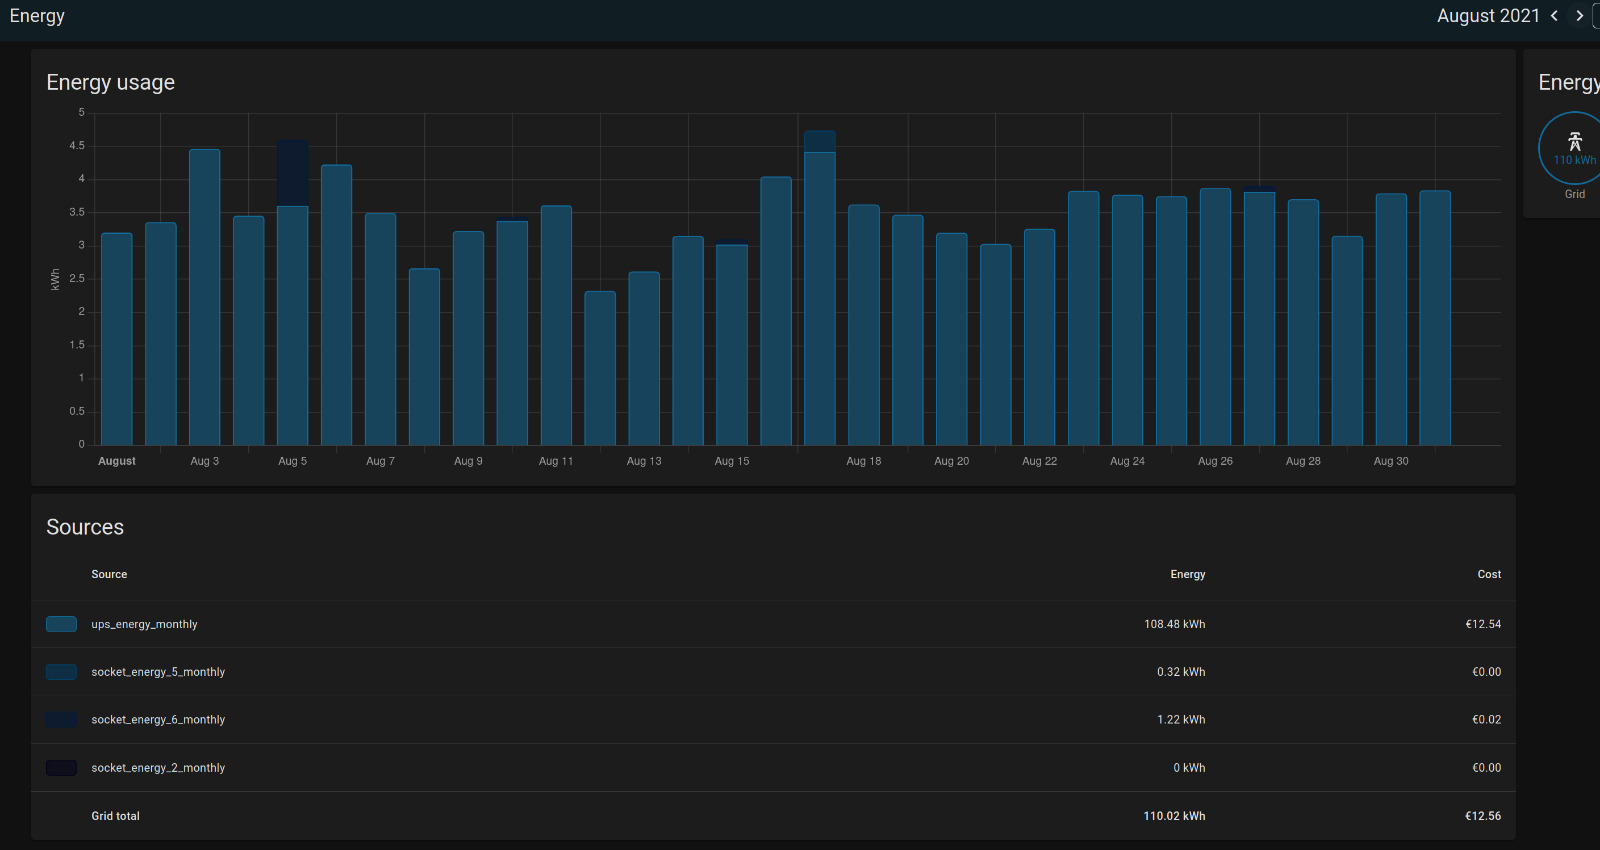
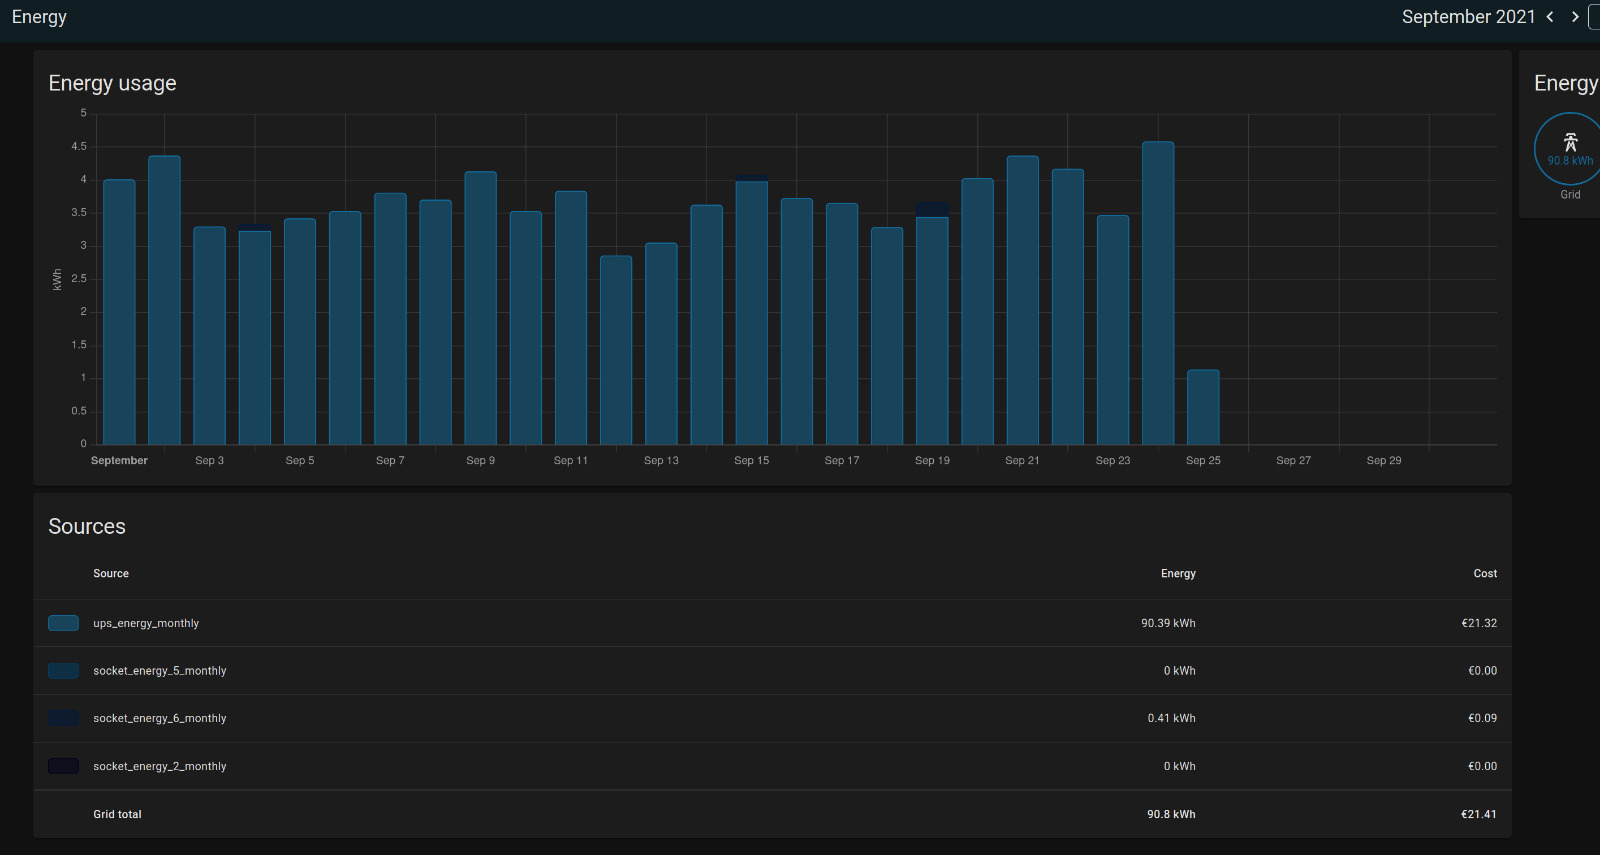
in July it shows 50kWh/0€, August 108kWh/12€ and september 90kWh/21€
Hi,
Would anyone know how I would write a gauge or data set to record my highest KW usage for my house between a certain time.
For example my utility provider changes me what they call a demand change, this change is a set fee .50c multiplied by my highest usage for the month for between the hours of 5pm and 8pm. I have the data just note sure how I could do it for example
Highest usage for July between those house was on 20th and it was 8kws.
Any help would be appreciated.
I am also facing similar situation.
I was perviously using wifi connection to Huwaei inverter itself, which was reading correctly without any abnormal spike readings. Only issue was weak wifi signals of inverter which lead to missing/gaps in reading.

Since I updated my dongle’s firmware to read from wifi dongle’s wifi (which is more stable without any dropouts). I am facing abnormal spikes in hundreds


It can happen with any of the three values.

All three have state_class:total_increasing increasing.

Hi, I have read every post possible to get en entity to choose from on the energy dashboard but even after getting all required attributes for the entity, I simply dont see any entity to choose. Can somebody tell me what am I still missing?
Screenshots attached:


I see a capital K for kWh and I think it might be particular about that?
1 Like
Man! you made my day. Sometimes our eyes just see what they want to see. I had scanned my attributes so many times to see a difference in case but couldn’t spot that. I changed that to “kWh” and I am able to see the entities now. Thanks buddy !!
Hi all.
Is it possible to take care of passive heat by sun (thougth windows) based on a Forecast.Solar sensor like :
Forecast.Solar -> sensor.power_production_now
This power as to be not include in total house power, and not in returning power.
It’s usefull for driving classic heater (on sun exposed room).
thanks.
The Victorians households can get the in-home display electricity monitor for free under the government program.
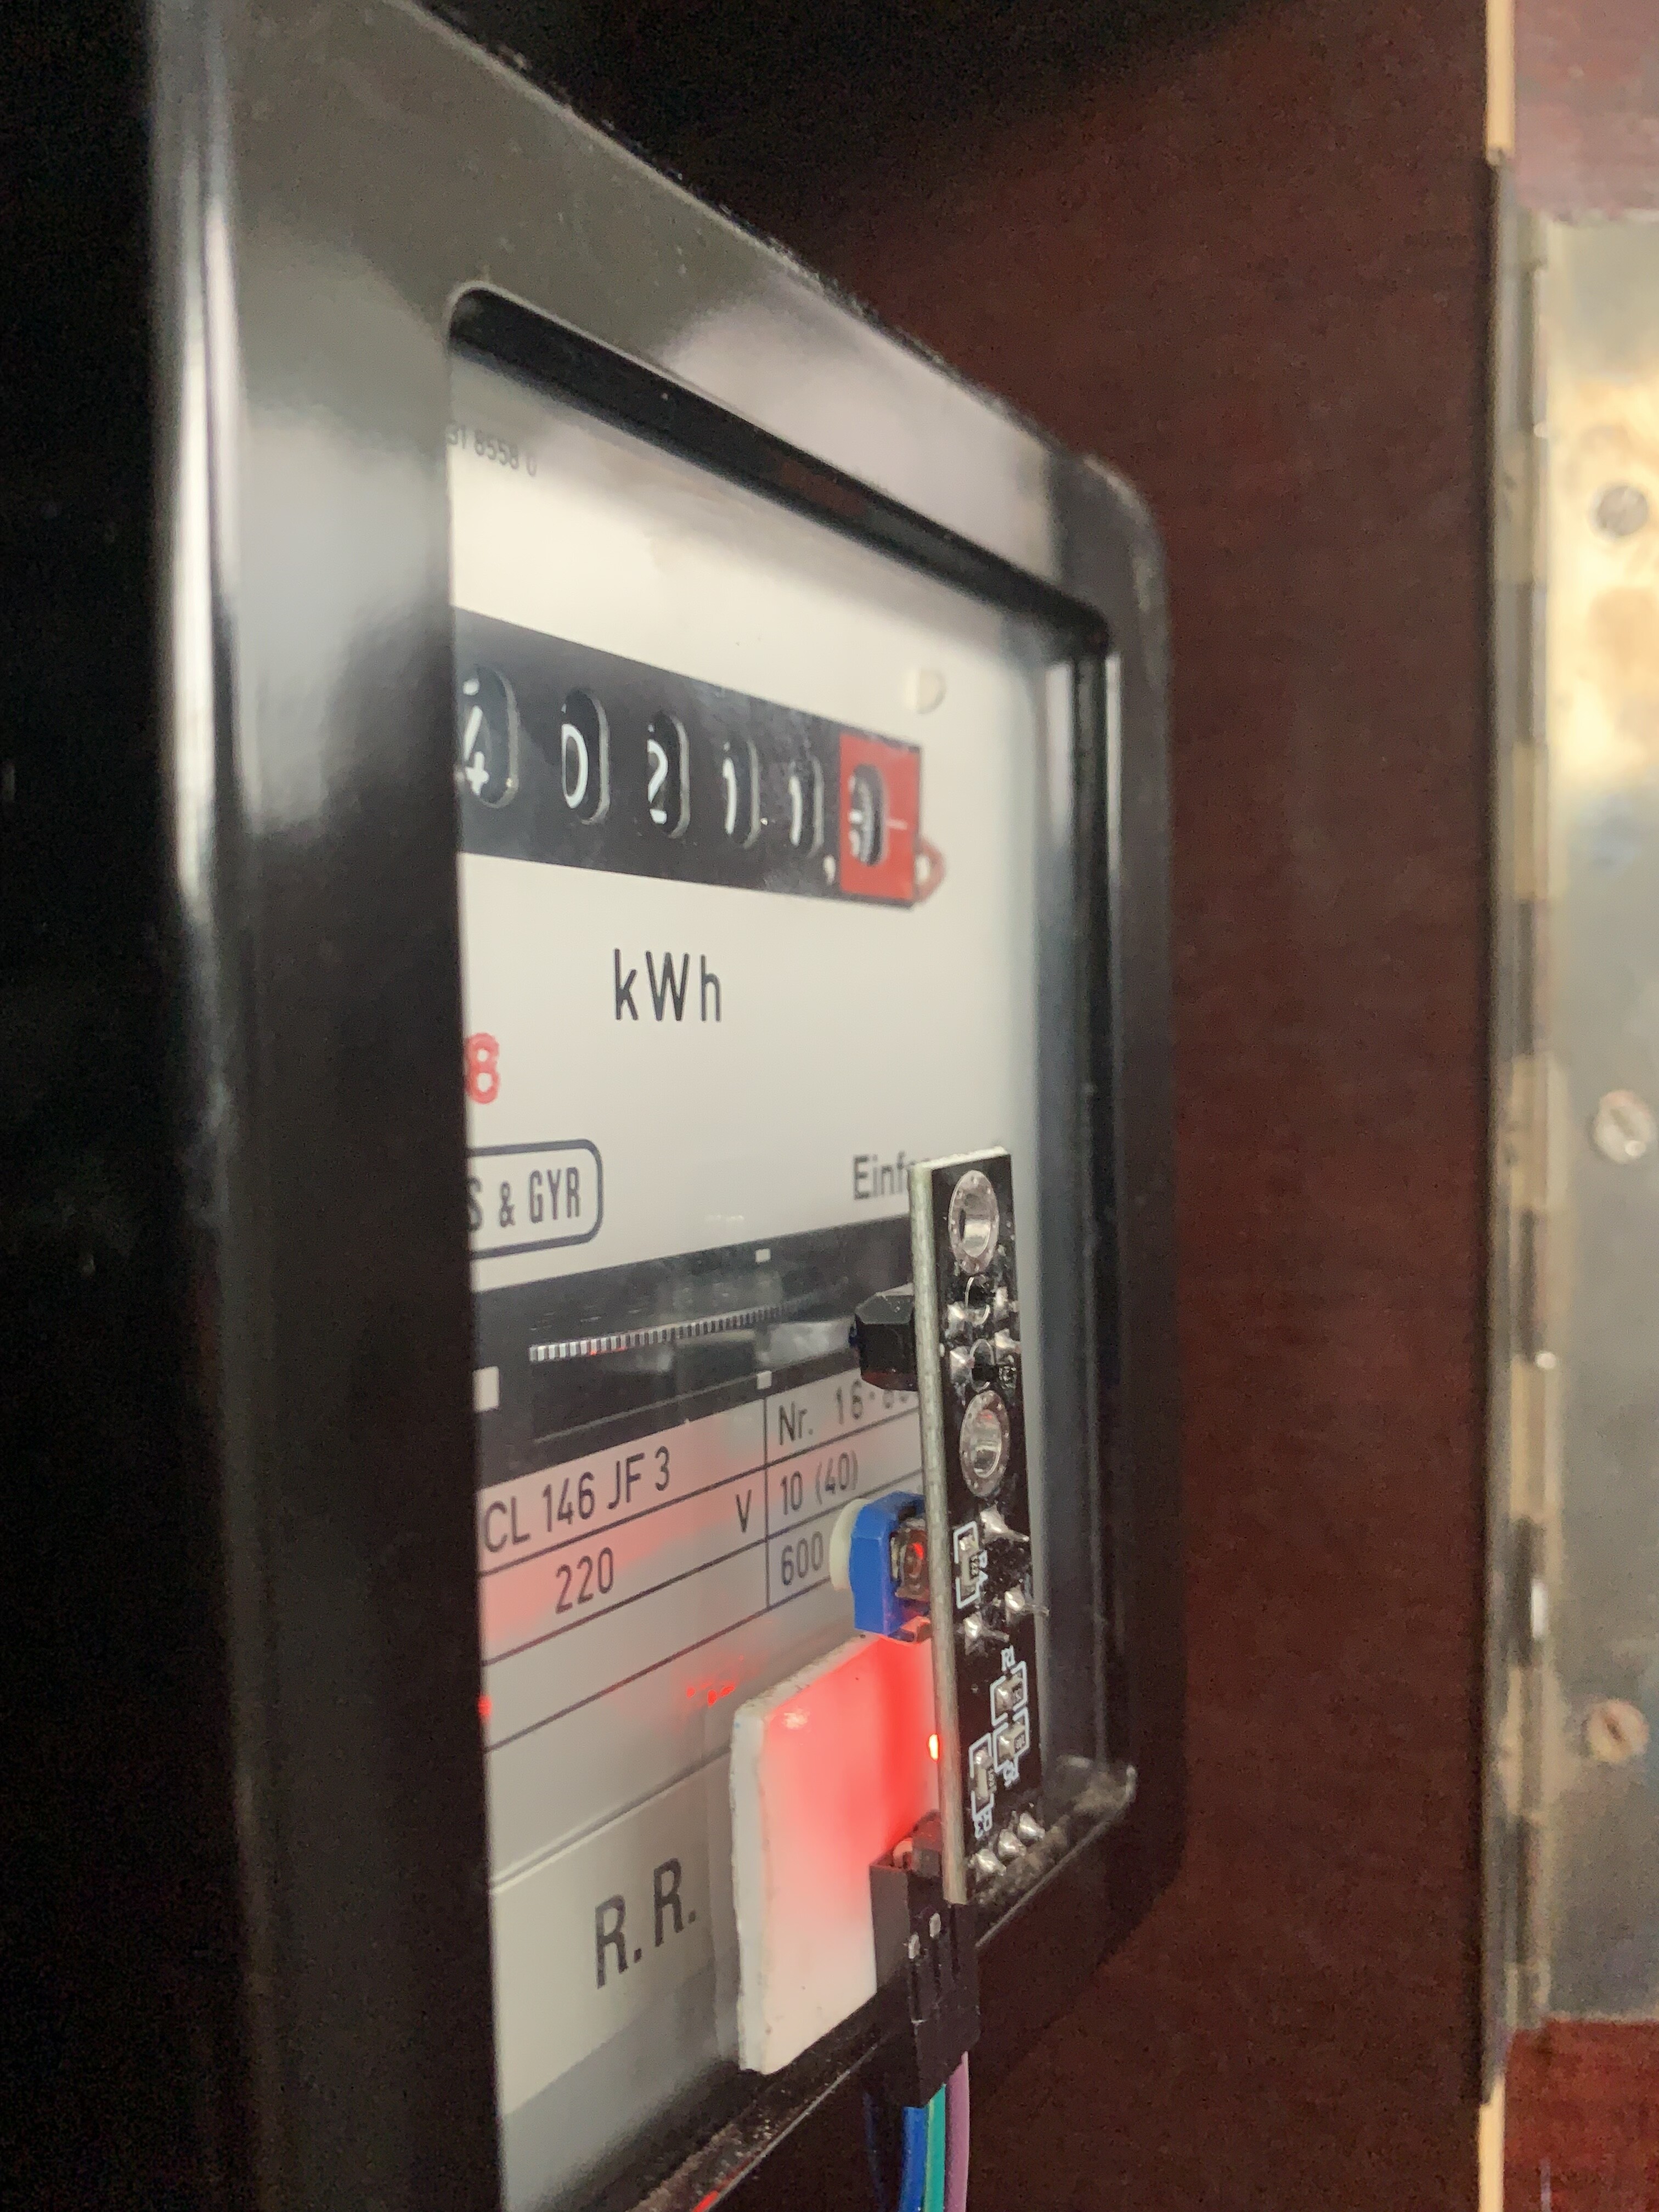
I got this KY-033 from sensor kit that i bought on aliexpress and connected it to the gpio and it works remarkably well for reading the disk revs in my old electric meter (should also work nicely for old gas meters) 
1 Like
Hello, I have a strange issue with the kw calculation.
I use the platform integration to convert watt to kwh
  - platform: integration
    source: sensor.amp2_watt2_pos
    name: amp2_kw2_pos
    unit_prefix: k
    round: 2
Look at the jump in the kwh graph between 7 an 8. How is this possible ?

Maybe related. Since my current sensor is not correct in the low voltage range I suppress the value to 0 when sun is below horizon. I also limit the max value to the max value of the solar installation with the following state filter :
      state: >
        {% if states.sun.sun.state == "above_horizon" %}
          {% if states.sensor.amp2_watt2.state | float < 5290 %}
            {{states('sensor.amp2_watt2') | float | abs}}
          {% else %}
            3526.00
          {% endif %}
        {% else %}
          0.00
        {% endif %}
I am also off the grid completely and am using the energy feature. The graph is just skewed, because I configure my Inverter output as “grid consumption”, so it is now adding solar production and grid consumption as total consumption. I’m still working on the battery charge/usage data, so that might help clarify. How did you end up using this feature. It seems geared towards grid connected systems.

I fixed this with a template sensor
I also limit the spikes since in some rare occasions I have strange spikes above what is possible. Limit is set to 240v 40A = 9600w
template
  - sensor:
    - name: "amp2_watt1_pos"
      device_class: power
      state_class: measurement
      unit_of_measurement: "W"
      icon: mdi:alpha-w-circle-outline
      state: >
        {% if states.sensor.amp2_watt1.state | float >= 0 %}
          {% if states.sensor.amp2_watt1.state | float < 9600 %}
            {{states.sensor.amp2_watt1.state}}
          {% else %}
            9600
          {% endif %}
        {% else %}
          {% if states.sun.sun.state == "above_horizon" %}
            0.00
          {% else %}
            {% if states.sensor.amp2_watt1.state | float | abs <  9600 %}
              {{states.sensor.amp2_watt1.state | float | abs }}
            {% else %}
              9600
            {% endif %}
          {% endif %}
        {% endif %}
  - sensor:
    - name: "amp2_watt1_neg"
      device_class: power
      state_class: measurement
      unit_of_measurement: "W"
      icon: mdi:alpha-w-circle-outline
      state: >
        {% if states.sensor.amp2_watt1.state | float < 0 %}
          {% if states.sun.sun.state == "above_horizon" %}
            {% if states.sensor.amp2_watt1.state | float | abs <  9600 %}
              {{states.sensor.amp2_watt1.state | float | abs }}
            {% else %}
              9600.00
            {% endif %}
          {% else %}
            0.00
          {% endif %}
        {% else %}
          0.00
        {% endif %}

sensor
  - platform: integration
    source: sensor.amp2_watt1_pos
    name: amp2_kw1_pos
    unit_prefix: k
    round: 2
  - platform: integration
    source: sensor.amp2_watt1_neg
    name: amp2_kw1_neg
    unit_prefix: k
    round: 2
Amazig feature! Besides Solar panels I also own a (small) piece of a windmill (windshares), so I also “produce” wind-energy each day. I managed to be able to add these values to the energy graph, but it would be great if there was a special option for Wind. Now I have to add it within my home usage, which obviously isn’t correct. It would be great if I could add it at the spot of the green circle: produced outside my home, returned to the grid. Is this already possible, or perhaps a future option?
Perhaps off-topic but what kind of windmill do you have and how much energy does it produce on yearly basis?
How did you actually get this to work? I bought similar tcrt5000 ( https://www.amazon.de/dp/B07VP4JDTH ) modules, and it’s absolutely impossible to make them differentiate between anything else than completely black and white 
Well it dust worked ![]() , setting the sensitivity to low and it will register the reflection of the metal vs the paint.
, setting the sensitivity to low and it will register the reflection of the metal vs the paint.

1 Like
I read something about a bug in the integration function, you should add
method: left
to your configuration to correct this.