Nick means, either paste it in the template editor and show the output, or show the full state using the state tools (all under the developer tools).
Secondly, format the code in your original post. Nobody knows if you possibly have another error.
Nick means, either paste it in the template editor and show the output, or show the full state using the state tools (all under the developer tools).
Secondly, format the code in your original post. Nobody knows if you possibly have another error.
This may help.
Am I incorrect to assume I should see data on my individual devices in the “There is no data for this period.” area?
Not unless you put them under Grid Consumption
Where (the hell, searching for weeks in several attempts!) in the database is the energy dashboard information stored?
I accidentally added a wrong sensor once which now still fakes all statistics (weekly/monthly/yearly):
To the (few?) database gurus:
How to identify the data of a certain hour? I’ll need to drop the data for that hour and hopefully the day/month/year statistics will correct themselves.
Update: solved with/in Energy Management in Home Assistant - #1127 by e-raser.
You can try serach from states table:
select state_id, state, last_changed, last_updated, old_state_id from "states" where entity_id="sensor.your_sensor_name_energy" order by state_id desc;
Or from statistics, if this graph from energy tab:
select * from "statistics" where metadata_id=(select id from "statistics_meta" where statistic_id="sensor.your_sensor_name_energy") order by id desc;
Or from short_term statistics table:
select * from "statistics_short_term" where metadata_id=(select id from "statistics_meta" where statistic_id="sensor.your_sensor_name_energy") order by id desc;
And if you find abnormal row, you can delete it by id number or update to the normal value, like this:
update "states" set state="1472.85" where state_id=244913;
update "statistics" set sum=4095.6 where id=11505;
update "statistics_short_term" set state=177.93 where id=311434;
Hi, can you please explain if you already solved the negative energy issue? , @luisgarcia87 can you explain what you mean with total energy? in my case I am using a sonoff pow and I am getting the todays energy as sensor, but I am getting a negative value in at 23 hours, can you please help how you manage to fix it? thnks
Hi Gutek, did you are able to fix you sonoff pow energy sensor? I have same problem and would like to see how to configure it thanks
@farid I did fix the negative value for the sensor, well I didn’t fix the negative value (that kept showing up, but what I did was use another sensor to get the same information in a different way. I just changed from a sensor that had daily solar generation that reset to 0 at the beginning of solar generation the next day (measurement state class) To a total generation sensor (generated solar production for the inverter since it started functioning in my home (total_increasing state class). This total_increasing sensor won’t ever reset back to 0 it will always increase day by day, that way I can’t get a negative value from it.
Do you have any sensor like that on your integration?
so you changed the state class from measurement to total_increasing? I created the sensor with state class as measurement may be this is the issue?
I changed the sensor as well. You can’t use total_increasing as a state class for a daily generation sensor for example because at some point it will reset to 0 the next day, and that is not how a total_increasing sensor should behave (Im in no way an expert. I could be wrong but it’s what I think). What sensor do you have?
these are my sensors
sensor:
- platform: template
  sensors:
    today_solar_energy_generation:
      friendly_name: "today_energy"
      device_class: energy
      unit_of_measurement: kWh
      value_template: "{{ state_attr('switch.sonoff_10011050fb', 'consumption')[0] }}"

    yesterday_solar_energy_generation:
      friendly_name: "yesterday energy "
      device_class: energy
      unit_of_measurement: kWh
      value_template: "{{ state_attr('switch.sonoff_10011050fb', 'consumption')[1] }}"

homeassistant:
  customize:
    sensor.today_solar_energy_generation:
      last_reset: "2021-07-30T00:00:00+00:00"
      #state_class: measurement
      state_class: total_increasing
Do you have a sensor that reports how much has it generated in total? Or those are the only 2 sensors that you have?
If you want individual devices to show as a sub-set of the total consumption, you have to set up a template sensor that does:
RestConsumption = TotalMeasuredConsumption - DeviceA - DeviceB - DeviceC
Then add to grid consumption:
RestConsumption
DeviceA
DeviceB
DeviceC
It’s hacky, but the energy dashboard is pretty limited at the moment and this hack can work around the limitations. At least that’s the concept theory. For actual syntax you would have to look up Template - Home Assistant
First off, this is an amazing addition to Home Assistant and may be the reason why I bought CT clamps for my entire house >.<
I’ve noticed that the energy dashboard is effectively doubling my house consumption. Looking at each hour, it’s counting my inputs as well as my consumed solar as separate entities. This is probably a configuration error on my part but for the life of me I can’t figure it out. I had a look at the current thread but couldn’t find anything related so here’s my info.
Here’s how I’ve got it set up in HA
My Solar generation and feeding are correct (comparing to inverter app and utility providers data) but my consumed from grid is almost exactly double. Having a look at the hourly stats I think it’s coming from the “consumed solar” stat being counted as it’s own usage
Here you can see actual consumption is .52kWh but the graph shows it as 1.05
Has anyone seen this behavior before?
First of all let me start by saying that I might be wrong about this, but in my opinion on your Grid Consumption you should have only the consumption of your whole house, not individual consumption of devices like the a/c or the hot water unit, etc… You can add those devices to the individual devices, that way you can calculate from the 2 kwh you consumed at 9am, X% came from the a/c, X% from the stove and so on…
But… If you don’t have a global consumption of energy, but instead have separated entities that calculates your whole house consumption, then it makes sense that all your devices are on the grid consumption section.
How does the sensor “Solar Feed In kWh” gets calculated on Home Assistant? This might be the key to check what is going on.
I’ll tell you what I did to calculate this value (Return to Grid).
My setup are CT clamps to calculate total consumption (when values are positive) and generation (when values are negative). This entity is called sensor.watts From that I created 2 tempalte sensors: one that counts only positive values (anything <0 will be ignored) and another one that counts only negative values (anything >0 will be ignored):
  - platform: template
    sensors:
      # Negative values only - if not negative return 0, otherwise provide "Return to Grid" Value
      house_energy_negative:
        unique_id: house_energy_negative
        unit_of_measurement: 'W'
        device_class: Power
        value_template: >
          {% if states('sensor.watts') | int > 0 %}
            0
          {% else -%}
            {{ (states('sensor.watts') | float) | abs }}
          {% endif %}

      # Positve values only - if negative, return 0, otherwise provide "Power from Grid" Value
      house_energy_positive:
        unique_id: house_energy_positive
        unit_of_measurement: 'W'
        device_class: Power
        value_template: >
          {% if states('sensor.watts') | int > 0 %}
            {{ states('sensor.watts') }}
          {% else -%}
            0
          {% endif %}
From that then using the Integration - Riemann sum integral I convert those watts values to KwH
  - platform: integration
    source: sensor.house_energy_negative
    name: energy_sent_back_to_grid
    unit_prefix: k
    round: 2
  - platform: integration
    source: sensor.house_energy_positive
    name: energy_spent_energy_positive
    unit_prefix: k
    round: 2
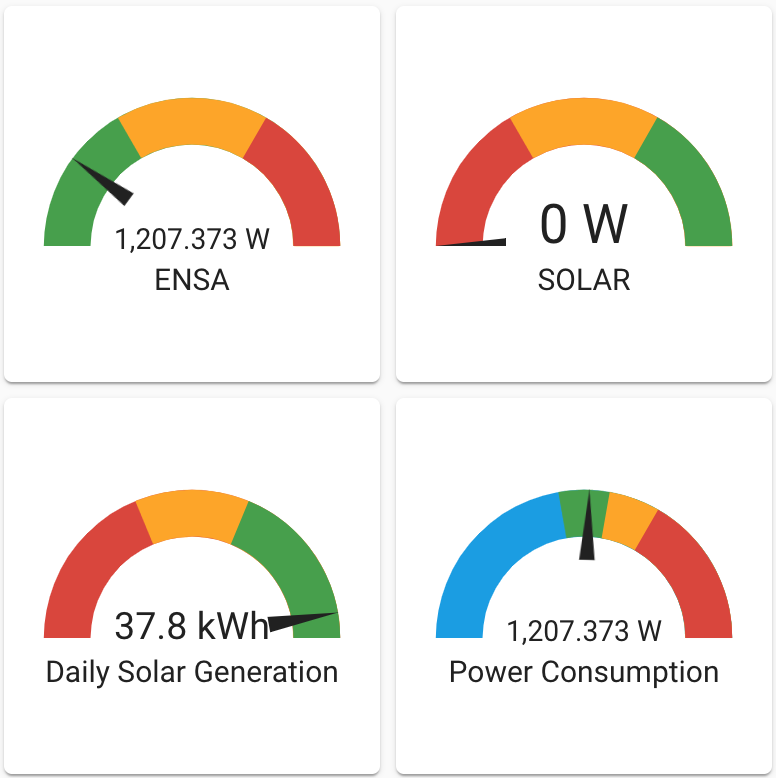
Now I have 2 sensors (top left and top right of the next picture)
When Im generating more power than what my house consume the “SOLAR” gauge will display watts (in positive) and the Riemann sum integral will convert it to KwH and add to the energy dashboard as “Return to Grid” and when Im consuming more power than the solar generation then the “ENSA” (that’s the name of my energy provider) gauge will display watts (in positive as well) and will be added to the Grid Consumption on the energy dashboard.
On the bottom right image you can also see the main sensor where “ENSA” and “SOLAR” takes the info “sensor.watts” and this sensor could go negative or positive, but the template sensor are the ones that help Energy Dashboard now what is consumption and what is generation in my case.
Hope this helps!
Is there any way to correct/edit data in the Energy module?
After a system update yesterday my inverter and metering entities were changed and this resulted in both erroneous and missing data in the Energy module, up until I was able to sort out the energy entities.
Hey! Firstly, thanks for the detailed reply 
I think we’re doing very similar things, but they might be slightly different. My current setup (finger guns) measures power draw of each circuit (RCD → house) and Solar (Inverter → grid). Solar Feed in KwH is calculated similar to you and I have two main measurements, Net grid draw and current feed in. Both of these get turned into daily kWh measurements. These are in addition to totals for each individual circuit.
I know the feed in watts is accurate since it matches exactly what my energy provider is measuring too
  #Grid Draw Watts
  - platform: template
    name:  Grid Draw
    id: gridDrawWatts
    lambda: return id(totalWatts).state - id(solarWatts).state;
    accuracy_decimals: 1
    unit_of_measurement: W
    icon: "mdi:flash"
    update_interval: ${update_time}

  #Total Feed In Watts
  - platform: template
    name:  Feed In Watts
    id: feedInWatts
    lambda: !lambda |-
      if ((id(solarWatts).state - id(totalWatts).state) < 0) {
        return 0;
      } else {
        return id(solarWatts).state - id(totalWatts).state;
      }
    accuracy_decimals: 1
    unit_of_measurement: W
    icon: "mdi:flash"
    update_interval: ${update_time}

  #kWh
  - platform: total_daily_energy
    name: Total Solar kWh
    power_id: solarWatts
    filters:
      - multiply: 0.001
    unit_of_measurement: kWh

  #kWh
  - platform: total_daily_energy
    name: Solar Feed In kWh
    filters:
      - multiply: 0.001
    power_id: feedInWatts
    unit_of_measurement: kWh
Is there any info on how “consumed solar” is calculated? I swapped to having a single entity for all power draw and a single for solar generation but I’m still seeing the same behaviour 
Consumed Solar is probably autogenerated because you set up the 2 solar values: Total Solar kwh and Solar Feed In kWh. Those two are correct and the intended way the energy dashboard was designed.
The problem is, grid consumption is only designed to be a measurement of what flows from the grid to your house. But by setting up devices this confuses the system. Your devices could be fed by solar, or they could be fed by the grid. The system does not know and assumes, it’s fed by the grid, which is wrong, because they are fed by solar. Now your total consumption is all the mysterious solar that disappears (Solar Feed In kwh is lower than Total Solar kwh) + all the devices that are “directly powered by the grid”. Of course we know that this is the same. But the system counts it double.
As for the solution, I am not sure, you probably have to remove one of the consumptions. Maybe deleting Solar Solar Feed In kwh will prevent the Consumed Solar calculation. Or basically once you have Solar Feed In kwh > 0 you have to set all device grid consumptions to 0, because you know they are all powered by solar, not by the grid. Both solutions are not ideal and it does not seem to be possible to have a graph in the way that it combines multiple devices, solar usage, solar feed in, grid consumption, battery charging and usage in one graph.