This is a roughly right script to determine the daily average power peaks per month as used in Sweden (and other places maybe including Beligium?, Netherlands?). I used the method defined by Ellevio in Sweden here:
https://www.ellevio.se/abonnemang/ny-prismodell-baserad-pa-effekt/
After a number of months of use, it works well (as well as the input sensor is capable) and aligns well with our grid suppliers data.
I use this code today for some simpler load shedding / balancing / planning by being able to set a maximum allowed energy use each hour (based on the usage peaks and prices and monthly averages) to keep the peaks and prices lower.
output
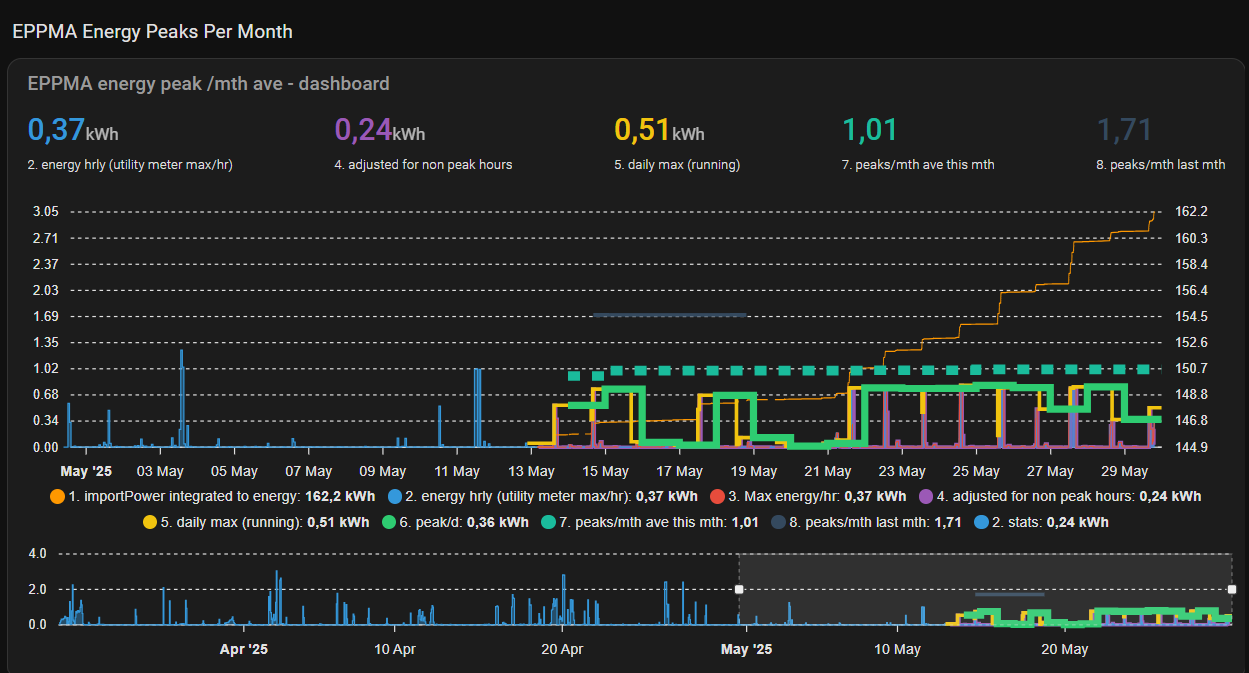
The script provides a number of sensors to be able to support deeper understanding and debugging, they are numbered from 1 and up prefixed by EPPMA so they are easy to find and understand how they flow!
Within the script you will find more info regarding how it works, the process and the actual sensors.
Graphically, here is an early example in Apex charts, Apex is great for checking/debug:

And here is another example also quite early on without too much data as I had just cleared things after an update but including monthly comparison:

How to get it working
pre-requisites
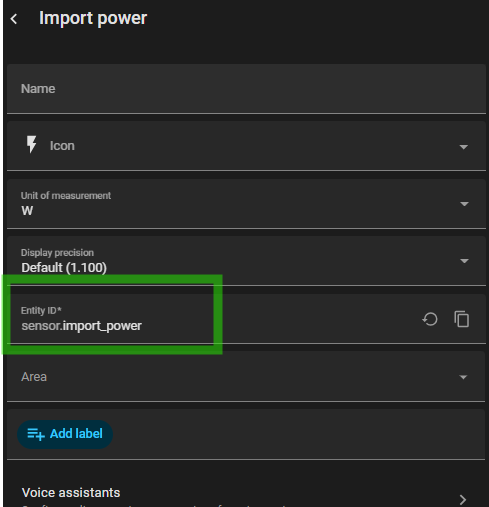
An import power (W) sensor is the only sensor needed - IF you have a sensor already in kWh and in a good enough time period then you should be able to just put it into step 3! Mine did not run so often (like every 5-10min) so I went to import power which updates every few seconds which then required the integration (step 2)
configuration/install instructions
1. put the following line(s) in your configuration.yaml in the appropriate place (you can change the directory but you need to change it then appropriately):
homeassistant:
    packages:
      eppma_energy_peaks_per_month_average: !include packages/eppma_energy_peaks_per_ month_average.yaml
2. put the yaml in your package directory “packages”, name as described in config.yaml (1)
3. Replace the import power sensor name in the code to your actual sensor name in the yaml code! (~row 245)
4. restart!
now it should be running!
5. verify it is working! Either via sensors or Apex-charts graphical interface, code I use is found in the readme.md on github
a. after 5-10min check values in eppma_1 & 2 after a few moments (so long as you are importing data you will see something)
b. after 1st hour check values in eppma_3 & _4 for values from previous hour
c. after 1st day after 00:00 check eppma_5 & _6 and even 7 for previous days values
d. after 1st of month after 00:00ish check eppma _8 for results from previous month
help, advice, tips, improvements?
I can certainly learn more when it comes to jinja/yaml so I guess there are some improvements to be made here, some things I have identified ![]() which you can find in the open issues in the TODO section of the header within the code. If you find something or have ideas, let me know!
which you can find in the open issues in the TODO section of the header within the code. If you find something or have ideas, let me know!
![]()