the purpose of this is to roughly right determine the daily average power peaks per month as used in Sweden (and other places maybe including Beligium?, Netherlands?). I used the method defined by Ellevio in Sweden here:
https://www.ellevio.se/abonnemang/ny-prismodell-baserad-pa-effekt/
(previously I called this code by Ellevio but have renamed it to a general name EPPMA and did some serious refactoring (beware))
The hope is to ultimately use this for load shedding / balancing / planning by being able to set a maximum allowed energy use each hour (based on the usage peaks and prices) to keep the peaks and prices lower.
After a few days, the data collection is all now seemingly working pretty well.
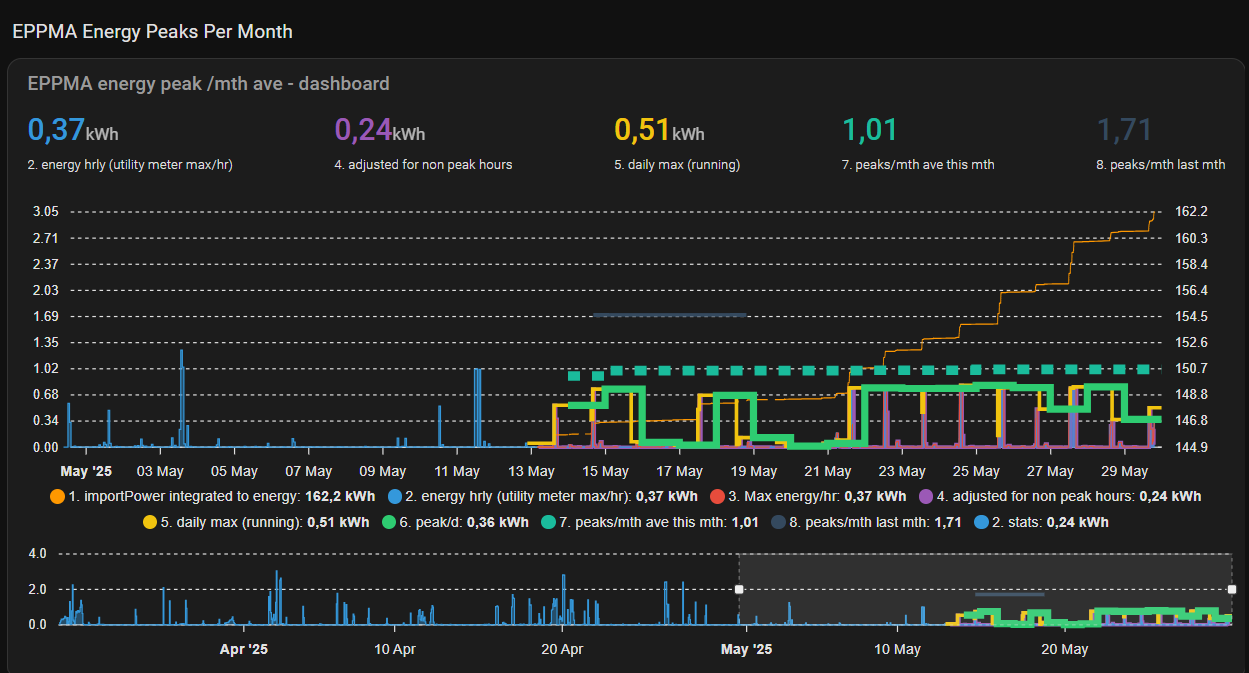
graphically in apex charts it is looking like this for checking/debug (previously):

latest albeit without much data at the moment as I just cleared things in the update(s):

It is quite a few steps and I am using Apex to present it so far. It has recovered well with various hiccups and I have now (230521) checked this vs Ellevio in detail and it has been preforming well but it will not be 100% as the import data I have is not 100%, again the idea is to get roughly right.
if you want to try have a look, see below install and process to understand
help, advice, tips, improvements?
I am guessing as I am not so great at jinja/yaml that there are some improvements to be made here, some things I have identified ![]() some things I see you can find in the open issues in the TODO section of the header
some things I see you can find in the open issues in the TODO section of the header
give it a try! here is the install/config
install and code incl apex chart config
pre-requisites
import power is needed and as it comes in it is integrated to kWh… if you have it already in kWh in a good enough time period you should be able to just put it into step 3! Mine did not run so often so I went to import power.
NOTES
see notes in code incl process flow and TODOs (improvements?)
configuration/install instructions
1. (of 4) put in the line in your configuration.yaml:
homeassistant:
    packages:
      eppma_energy_peaks_per_month_average: !include packages/eppma_energy_peaks_per_ month_average.yaml
2. (of 4) put the package in your package directory “package” with the name described in yaml (you can change director but you need to change it the config.yaml above)
## ENERGY PEAKS PER MONTH AVERAGE (EPPMA) ((EFFEKTTOPP))
## NOTES
  # 0. based on ellevio information here https://www.ellevio.se/abonnemang/ny-prismodell-baserad-pa-effekt/#h-exempel-elanvandning-och-effektavgift
    # (many other electric companies use this depending on country - sweden and maybe belgium and the netherlands.
    # variables : this allows you to
      # a. adjust the number of peaks by changing the initial dictionary size in eppma_7 add a row of fake data or remove them
      # b. adjust the time of day for reduction in peak values in eppma_3 now 22:00 to 06:00
  # 1. naming convention : aeppma_*#* where # is the step in the process
  # 2. time shifts : values for hourly sensors (eppma_4 and above) are +1hr (and in the case of sensor values for the day it is next day)
    # until reset the following day. This is so the sensor can take into account the full hour values
    # eg values from 11:00-12:00 eppma_4-5 will shown between 12:00-13:00
    # and eppma_6 & 7 will give values on the day after, (for 6 it is even just the first day of the month)
    # eppma_8 is the previous months value
  # 3. BUG average of peaks : eppma_7 - NOTE! there is NO feature to chcking having duplicates! do not run multiple times it can overwrite already placed data over data that is pertinent.

## process flow
  # 1. import power -> integrate it to kWh.. i have power in watts coming in this should give kWh
  # 2. utility meter #1  - getting an hourly kWh usage
  # 3. find the max of #2
  # 4. every "hours: /1" take #3 and adjust the values to take into account off peak and save - this is the hourly average (again this is showing data on the hour following the data measured)
  # 5. get the rolling maximum of #4 per day  - this is at end of day the peak during the day
  # 6. at 00:00 and 5s and after #5 runs return the maximum per day of #5 - this is the daily maximum (saved on next day unfortunately)
  # 7. find the 3 peaks highest of #6 per month and average - 3 peaks per month average
  # 8. once per month get last months value from 7 and save it during the current month
  # ---- i have gotten this far -----
  # 9. ?? multiply #7 by consumption to get actual cost impact (?)

## CHANGES keep previous and this version change list
  # 250312 - initilization of 7, fixed value sort of 7 to get everything over 0 not 0.001
  # 250320 - changes incl changed name from ellevio to eppma
    # made this a package instead of random stuff
    # correction on ellevio_ version removed average on 3 and made it max value instead
    # fixed triggers instead of time
    # included datetime data in eppma_7 as output to make it easier to read directly
    # added 8 a monthly keeper of last months data
  # 250328+ 1. included lowest_peak as an attribute in eppma 7 and 8 as value to potentially use as a roof for usage.
  # 250429 - new eppma_4 .. to include hightest value date/time to get it into eppma_7 which was adjusted for this.

## TODO
  # 250307a time shifts -see comments in the code but the data you see > eppma_3 is not applicable to the zone it is found, it is an hour or 1 day or even 1 month after.
  # 250307b sensor names - maybe i should have named the sensors better to address time shifts (?). eg.. it is not the hourly average now it is the hourly average of the last hour .. but if time shifts are fixed then they are maybe ok? eg in Apex I plot them and can add an offset there and it is solved.
  # 250320 - adjust data by 1hr? .. maybe actually output in eppma_7, correct time in 7?
  # 250321 triggering - i am still not happy with the triggering and timings.
  # 250529 fix actual times to be correct as they are now off a bit due to the translation between datetime to timestamp and back

utility_meter:
## UTILITY METER ENERGY PEAKS PER MONTH AVERAGE (EPPMA)
  eppma_2_energy_per_hour:
    name: "EPPMA 2 Energy per hour"
    source: sensor.eppma_1_import_power_to_energy_spent_integral
    unique_id: a7a703a5-4894-4ed0-a6c6-56392c488475
    cycle: hourly

template:
## TRIGGER SENSORS ENERGY PEAKS PER MONTH AVERAGE (EPPMA)
  - trigger:
      - trigger: time_pattern
        hours: /1
        minutes: 0
        seconds: 0
      - trigger: state
        entity_id:
          - input_button.eppma_4_trigger
    action:
      - variables:
          calc: >-
            {# ref https://www.ellevio.se/abonnemang/ny-prismodell-baserad-pa-effekt/
            ""
            Så fungerar det
            Effekten mäts som timmedeleffekt, vilket innebär genomsnittet av din totala elanvändning under en timme.
            Effektavgiften baseras på snittet av de tre högsta effekttopparna, det vill säga de tre timmar med högst timmedeleffekt, fördelade på tre olika dygn under månaden.
            Varje dygn mellan klockan 22 och 06 på morgonen är det dessutom billigare att använda elnätet. Då räknas bara halva effekttoppen.
            ""#}

            {% set hour_test = now().strftime('%H')  %}
            {% if hour_test >= "22" or hour_test <= "06"  %}
              {% set multiplier = 2 %}
            {% else %}
              {% set multiplier = 1 %}
            {% endif %}

            {% if hour_test == 1 %}
              {% set highest_hour_timestamp = as_timestamp(now()) %}
            {% endif %}

            {% set value_now = (states.sensor.eppma_3_energy_per_hour_max.state | float / multiplier ) | float %}

            {% if states.sensor.eppma_4_energy_hourly_value_adjusted_for_reductions_during_non_peak_hours_incl_time.state != 'unavailable'  and  states.sensor.eppma_4_energy_hourly_value_adjusted_for_reductions_during_non_peak_hours_incl_time.state != 'unknown' %}
              {% if value_now > states.sensor.eppma_4_energy_hourly_value_adjusted_for_reductions_during_non_peak_hours_incl_time.state | float %}
                {% set highest_hour_timestamp = as_timestamp(now()) %}
              {% else %}
                {% set highest_hour_timestamp = states.sensor.eppma_4_energy_hourly_value_adjusted_for_reductions_during_non_peak_hours_incl_time.attributes.highest_value_time %}
              {% endif %}
            {% else %}
              {% set highest_hour_timestamp = as_timestamp(now()) %}
            {% endif %}

            {{ value_now , highest_hour_timestamp }}

          calc_state:   '{{ calc[0] }}'
          calc_hour_timestamp:    '{{ calc[1] }}'
    sensor:
      - name:   "EPPMA 4 energy hourly value adjusted for reductions during non peak hours incl time"
        # name:  eppma_4_energy_hourly_value_adjusted_for_reductions_during_non_peak_hours_incl_time
        # sensor.eppma_4_energy_hourly_value_adjusted_for_reductions_during_non_peak_hours_incl_time
        ## value saved here is the previous hours value
        unit_of_measurement: "kWh"
        unique_id: c8684e66-76e9-4617-9b7d-b56334cdb910
        state: '{{ calc_state }}'
        attributes:
          highest_value_time: '{{ calc_hour_timestamp }}'


  - trigger:
      - trigger: time_pattern
        hours: /1
        minutes: 0
        seconds: 0
    # action:
    sensor:
      - name:   "EPPMA 4 energy hourly value adjusted for reductions during non peak hours"
        # name:  eppma_4_energy_hourly_value_adjusted_for_reductions_during_non_peak_hours
        # sensor.eppma_4_energy_hourly_value_adjusted_for_reductions_during_non_peak_hours
        ## value saved here is the previous hours value
        unit_of_measurement: "kWh"
        unique_id: f5e57a8d-ff03-4d65-bc90-8c4c044916b2
        state: >-
            {# ref https://www.ellevio.se/abonnemang/ny-prismodell-baserad-pa-effekt/
            ""
            Så fungerar det
            Effekten mäts som timmedeleffekt, vilket innebär genomsnittet av din totala elanvändning under en timme.
            Effektavgiften baseras på snittet av de tre högsta effekttopparna, det vill säga de tre timmar med högst timmedeleffekt, fördelade på tre olika dygn under månaden.
            Varje dygn mellan klockan 22 och 06 på morgonen är det dessutom billigare att använda elnätet. Då räknas bara halva effekttoppen.
            ""#}
            {% set hour_test = now().strftime('%H')  %}
            {% if hour_test >= "22" or hour_test <= "06"  %}
              {{ (states.sensor.eppma_3_energy_per_hour_max.state | float / 2) | float }}
            {% else %}
              {{ (states.sensor.eppma_3_energy_per_hour_max.state | float / 1) | float }}
            {% endif %}

  - trigger:
      - trigger: time
        at: "00:00:05" #delay 5s to make sure the last hourly value from eppma_5 is available.
      - trigger: state
        entity_id:
          - input_button.eppma_6_trigger
    sensor:
      - name: "EPPMA 6 energy peak per day"
        # sensor.eppma_6_energy_peak_per_day
        #entity_id: eppma_6_energy_peak_per_day
        unit_of_measurement: "kWh"
        unique_id: 69fc7eb1-12d6-4adf-b8de-04faafb7c3f3
        state: >-
          {{ states.sensor.eppma_5_energy_adjusted_daily_max_peak_value.state | float }}
        attributes:
          date_last_evaluated: >-
            {{ now().strftime('%Y%m%d%H%M%S') | float }}

  - trigger:
      - trigger: state
        entity_id:
          - sensor.eppma_6_energy_peak_per_day
        attribute: date_last_evaluated
      - trigger: state
        entity_id:
          - input_button.eppma_7_trigger
    action:
      - variables:
          results: >
            {# check value each day and see if it is higher than any of the items in the array of highest values if so then replace the appropriate data point #}
            {% set ev = states.sensor.eppma_6_energy_peak_per_day.state | float %}
            {% set evts = (states.sensor.eppma_4_energy_hourly_value_adjusted_for_reductions_during_non_peak_hours_incl_time.attributes.highest_value_time)  %}
            {% if state_attr('sensor.eppma_7_peaks_per_month_average_per_day', 'data_timestamp') == none or (now().strftime("%d") | int == 2 and now().strftime("%H") | int == 0 ) %}
              {% set in_dict =
                { -0.0001:  '946688400.0',
                  -0.001:   '946688400.1',
                  -0.01:    '946688400.2' } %}
              {% elif state_attr('sensor.eppma_7_peaks_per_month_average_per_day', 'data_timestamp') != none %}
                {% set in_dict = dict.from_keys(states.sensor.eppma_7_peaks_per_month_average_per_day.attributes.data_timestamp)  %}
            {% endif %}
            {% set in_eid = in_dict.get(in_dict.keys() | sort()
              | select('<=', ev | float(0))
              | first, -1 ) %}
            {% set ns = namespace( kvps=[], d={}, l=[] , ldt=[] ) %}
            {%- for key, value in in_dict | dictsort() %}
              {% if in_eid == in_dict[key] %}
                {% set ns.kvps = ns.kvps + [(ev, evts)] %}
                {% set ns.l = ns.l + [[ev, evts]] %}
                {% set ns.ldt = ns.ldt + [[ev, as_datetime(evts).strftime('%b %d %Y @%H:%M - %Y%m%d') ]] %}
              {% else %}
                {% set ns.kvps = ns.kvps + [(key, value)] %}
                {% set ns.l = ns.l + [[key, value]] %}
                {% set ns.ldt = ns.ldt + [[key, as_datetime(value).strftime('%b %d %Y @%H:%M - %Y%m%d') ]] %}
              {% endif %}
            {% endfor %}
            {% set av = dict.from_keys(ns.kvps  | selectattr( 0, 'gt', 0.000 ) | list) %}
            {{ av | average | float, ns.l | list , ns.ldt | list, ns.l[0][0]}}
            {# results to send, like after day 1:
            (0.4361
            , [[0.4361, 1742561081.363402], [-0.001, '946688400.1'], [-0.0001, '946688400']]
            , [[0.4361, 'Mar 21 2025 @12:44 - 20250321'], [-0.001, 'Jan 01 2000 @01:00 - 20000101'], [-0.0001, 'Jan 01 2000 @01:00 - 20000101']]
            , 0.4361 ) #}
          result_average:   '{{ results[0] }}'
          result_timestamp: '{{ results[1] | list }}'
          result_datetime:  "{{ results[2] }}"
          result_lowest:    '{{ results[3] }}'

    sensor:
      - name: "EPPMA 7 peaks per month average per day"
        # sensor.eppma_7_peaks_per_month_average_per_day
        #entity_id: eppma_7_peaks_per_month_average_per_day
        unique_id: 57ce4d4e-f8d9-412f-9d87-82b08e0bc462
        state: '{{ result_average }}'
        attributes:
          data_timestamp: '{{ result_timestamp }}'
          data_datetime: '{{ result_datetime }}'
          lowest_peak: '{{ result_lowest}}'


  - trigger:
      - trigger: template
        value_template: "{{ now().day == 1 and now().hour == 1 and now().minute == 1 }}" #on the first of the month after the data has been run through.
      - trigger: state
        entity_id:
          - input_button.eppma_8_trigger
    sensor:
      - name: "EPPMA 8 peaks per month average last months values"
        # sensor.eppma_8_peaks_per_month_average_last_months_values
        #entity_id: eppma_8_peaks_per_month_average_last_months_values
        unique_id: 4fdea9cc-d23f-48a6-beb9-f06aebd9cd3a
        state: >-
          {{ states.sensor.eppma_7_peaks_per_month_average_per_day.state }}
        attributes:
          data_timestamp: '{{ states.sensor.eppma_7_peaks_per_month_average_per_day.attributes.data_timestamp }}'
          data_datetime: '{{ states.sensor.eppma_7_peaks_per_month_average_per_day.attributes.data_datetime }}'
          lowest_peak: '{{ states.sensor.eppma_7_peaks_per_month_average_per_day.attributes.lowest_peak }}'

sensor:
## SENSORS ENERGY PEAKS PER MONTH AVERAGE (EPPMA)
  - platform: integration
    # name: eppma_1_import_power_to_energy_spent_integral
    name: "EPPMA 1 Import power to energy spent integral"
    unique_id: fdb30b8d-edfe-4bdc-b72a-2fa790422344
    source: sensor.import_power
    unit_prefix: k
    round: 4
    max_sub_interval:
      minutes: 5

  - platform: statistics
    name: "EPPMA 3 energy per hour max"
    # name: eppma_3_energy_per_hour_max
    ## max at end of period is max for previous hour
    unique_id: e4be715b-cfb4-42e7-bc1f-e20248e44eda
    entity_id: sensor.eppma_2_energy_per_hour
    state_characteristic: value_max
    max_age:
      hours: 1
    precision: 4

  - platform: statistics
    name: "EPPMA 5 energy adjusted daily max peak value"
    # name:eppma_5_energy_adjusted_daily_max_peak_value
    ## max at end of period is max for previous day
    unique_id: 168f3991-8e38-4d55-8b57-4e519cb8f4e1
    entity_id: sensor.eppma_4_energy_hourly_value_adjusted_for_reductions_during_non_peak_hours_incl_time
    state_characteristic: value_max
    max_age:
      hours: 24
      minutes: 0
    precision: 4

input_button:
  eppma_4_trigger:
    name: EPPMA 4 trigger
  eppma_6_trigger:
    name: EPPMA 6 trigger
  eppma_7_trigger:
    name: EPPMA 7 trigger
  eppma_8_trigger:
    name: EPPMA 8 trigger
    #manual trigger - TODO -- DELETE after testing (?)
Apex code
type: custom:apexcharts-card
update_interval: 2.5min
header:
  show: true
  title: EPPMA energy peak /mth ave - dashboard
  show_states: true
  colorize_states: true
experimental:
  brush: true
brush:
  selection_span: 1d
apex_config:
  chart:
    height: 300px
graph_span: 70d
span:
  start: day
  offset: "-69d"
yaxis:
  - id: first
    decimals: 2
  - id: second
    opposite: true
    decimals: 1
series:
  - entity: sensor.eppma_1_import_power_to_energy_spent_integral
    name: 1. importPower integrated to energy
    yaxis_id: second
    stroke_width: 1
    extend_to: false
    show:
      in_header: false
  - entity: sensor.eppma_2_energy_per_hour
    name: 2. energy hrly (utility meter max/hr)
    type: area
    curve: stepline
    yaxis_id: first
    stroke_width: 1
    extend_to: false
    show:
      in_header: true
    float_precision: 2
    opacity: 0.4
  - entity: sensor.eppma_3_energy_per_hour_max
    name: 3. Max energy/hr
    curve: stepline
    type: line
    yaxis_id: first
    stroke_width: 1
    extend_to: false
    show:
      in_header: false
    float_precision: 2
  - entity: >-
      sensor.eppma_4_energy_hourly_value_adjusted_for_reductions_during_non_peak_hours
    name: 4. adjusted for non peak hours
    type: area
    curve: stepline
    yaxis_id: first
    stroke_width: 3
    extend_to: false
    show:
      in_brush: true
      in_header: true
    float_precision: 2
    opacity: 0.6
  - entity: sensor.eppma_5_energy_adjusted_daily_max_peak_value
    name: 5. daily max (running)
    curve: stepline
    yaxis_id: first
    stroke_width: 3
    extend_to: end
    show:
      in_brush: true
    float_precision: 2
  - entity: sensor.eppma_6_energy_peak_per_day
    name: 6. peak/d
    curve: stepline
    yaxis_id: first
    stroke_width: 6
    extend_to: end
    show:
      in_brush: true
      in_header: false
    float_precision: 2
  - entity: sensor.eppma_7_peaks_per_month_average_per_day
    name: 7. peaks/mth ave this mth
    curve: stepline
    yaxis_id: first
    stroke_width: 8
    stroke_dash: 10
    extend_to: end
    show:
      in_brush: false
      in_header: true
    float_precision: 2
  - entity: sensor.eppma_8_peaks_per_month_average_last_months_values
    name: 8. peaks/mth last mth
    curve: stepline
    yaxis_id: first
    stroke_width: 3
    extend_to: false
    show:
      in_brush: true
      in_header: true
    float_precision: 2
3. after 5-10min check values in eppma_1 & 2 after a few moments (so long as you are importing data you will see something)
4. after 1st hour check values in eppma_3 & _4 for previous hour
5. after 1st day after 00:00 check eppma_5 & _6 and even 7 for previous day
6. after 1st of month after 00:00ish check eppma _8 for result from previous month
![]()