There are days where the energy usage diagram looks strange :
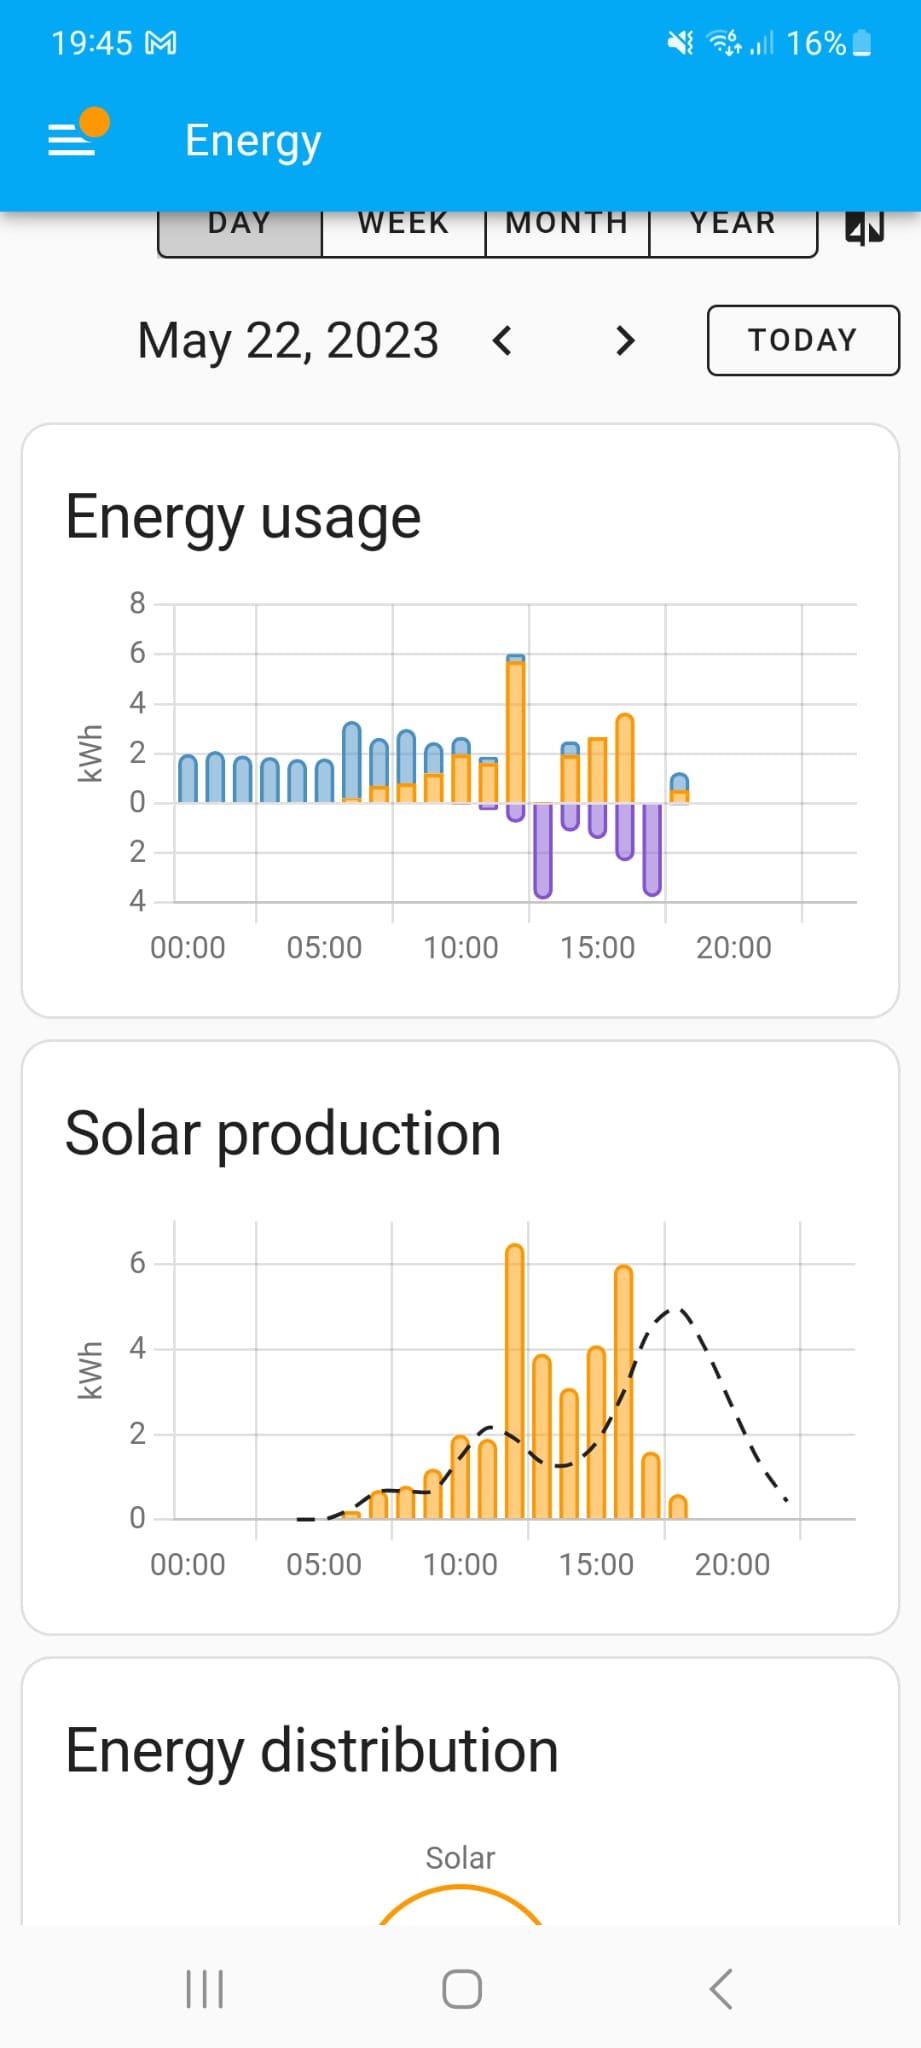
There seem to be hours with no consumption at all, all solar production or even more goes back to the grid, that cannot be.
What could be wrong here ?
There are days where the energy usage diagram looks strange :
The only thing I see, the consumption gets wrong as soon as production starts.
This is the same behavior each day.
Any idea, where to look for this ?
Check your sensor connectivity. The energy shows 0 values if your sensor was disconnected or unavailable during that period of time.
This happens to me when the solar system bounces or misses a few readings.
Ok, thanks.