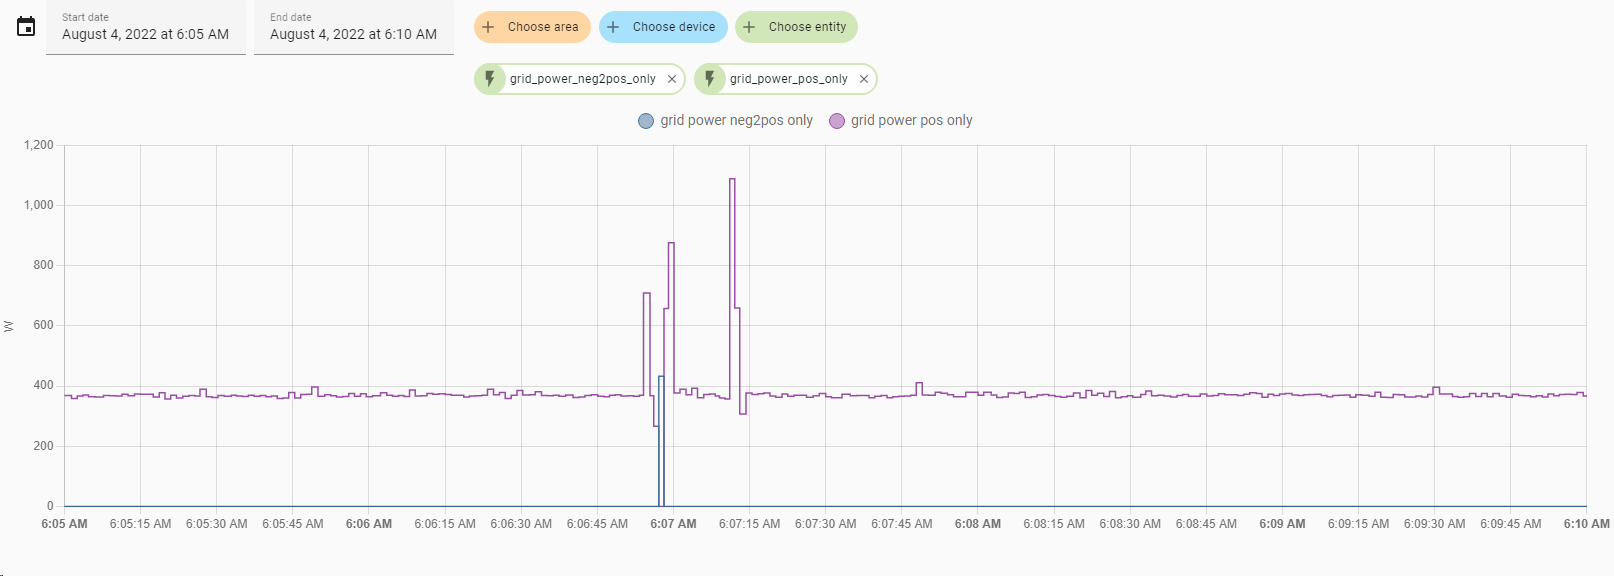
I’m using Reimann Sum helper to give a cumulative energy reading from a sensor that updates each second. It’s been quite accurate but every now and again gives a completely spurious reading. For example this between 6-7am:

The inputs to the Reimann Sum has one tiny spike of one reading (one second) at 433W on the ‘export’ reading, and zero for the rest of the hour, but even with trapezoidal Reimann sum, I can’t see how that accounts for a 1.7kWh export reading?
This has happened a few times now. I’ve seen some advice to change the Reimann sum integration to ‘left’ rather than ‘trapezoidal’ but that would require deleting and recreating the helpers, unless someone can point me a way to edit them? And I’m not convinced it’ll help; the maths just doesn’t add up
Thanks for your help!