Enphase Envoy with Energy Dashboard

Ian,
Thanks for you input. I have been out and about this morning with chores.

To compound things more we had a power outage last night from about 10 → 11PM. On generator for the hour!
Anyway …
This is the Entity list that Home Assistant Glow creates from GitHub - klaasnicolaas/home-assistant-glow: ⚡ The power of energy measurements in your house
You can see his code in this link.


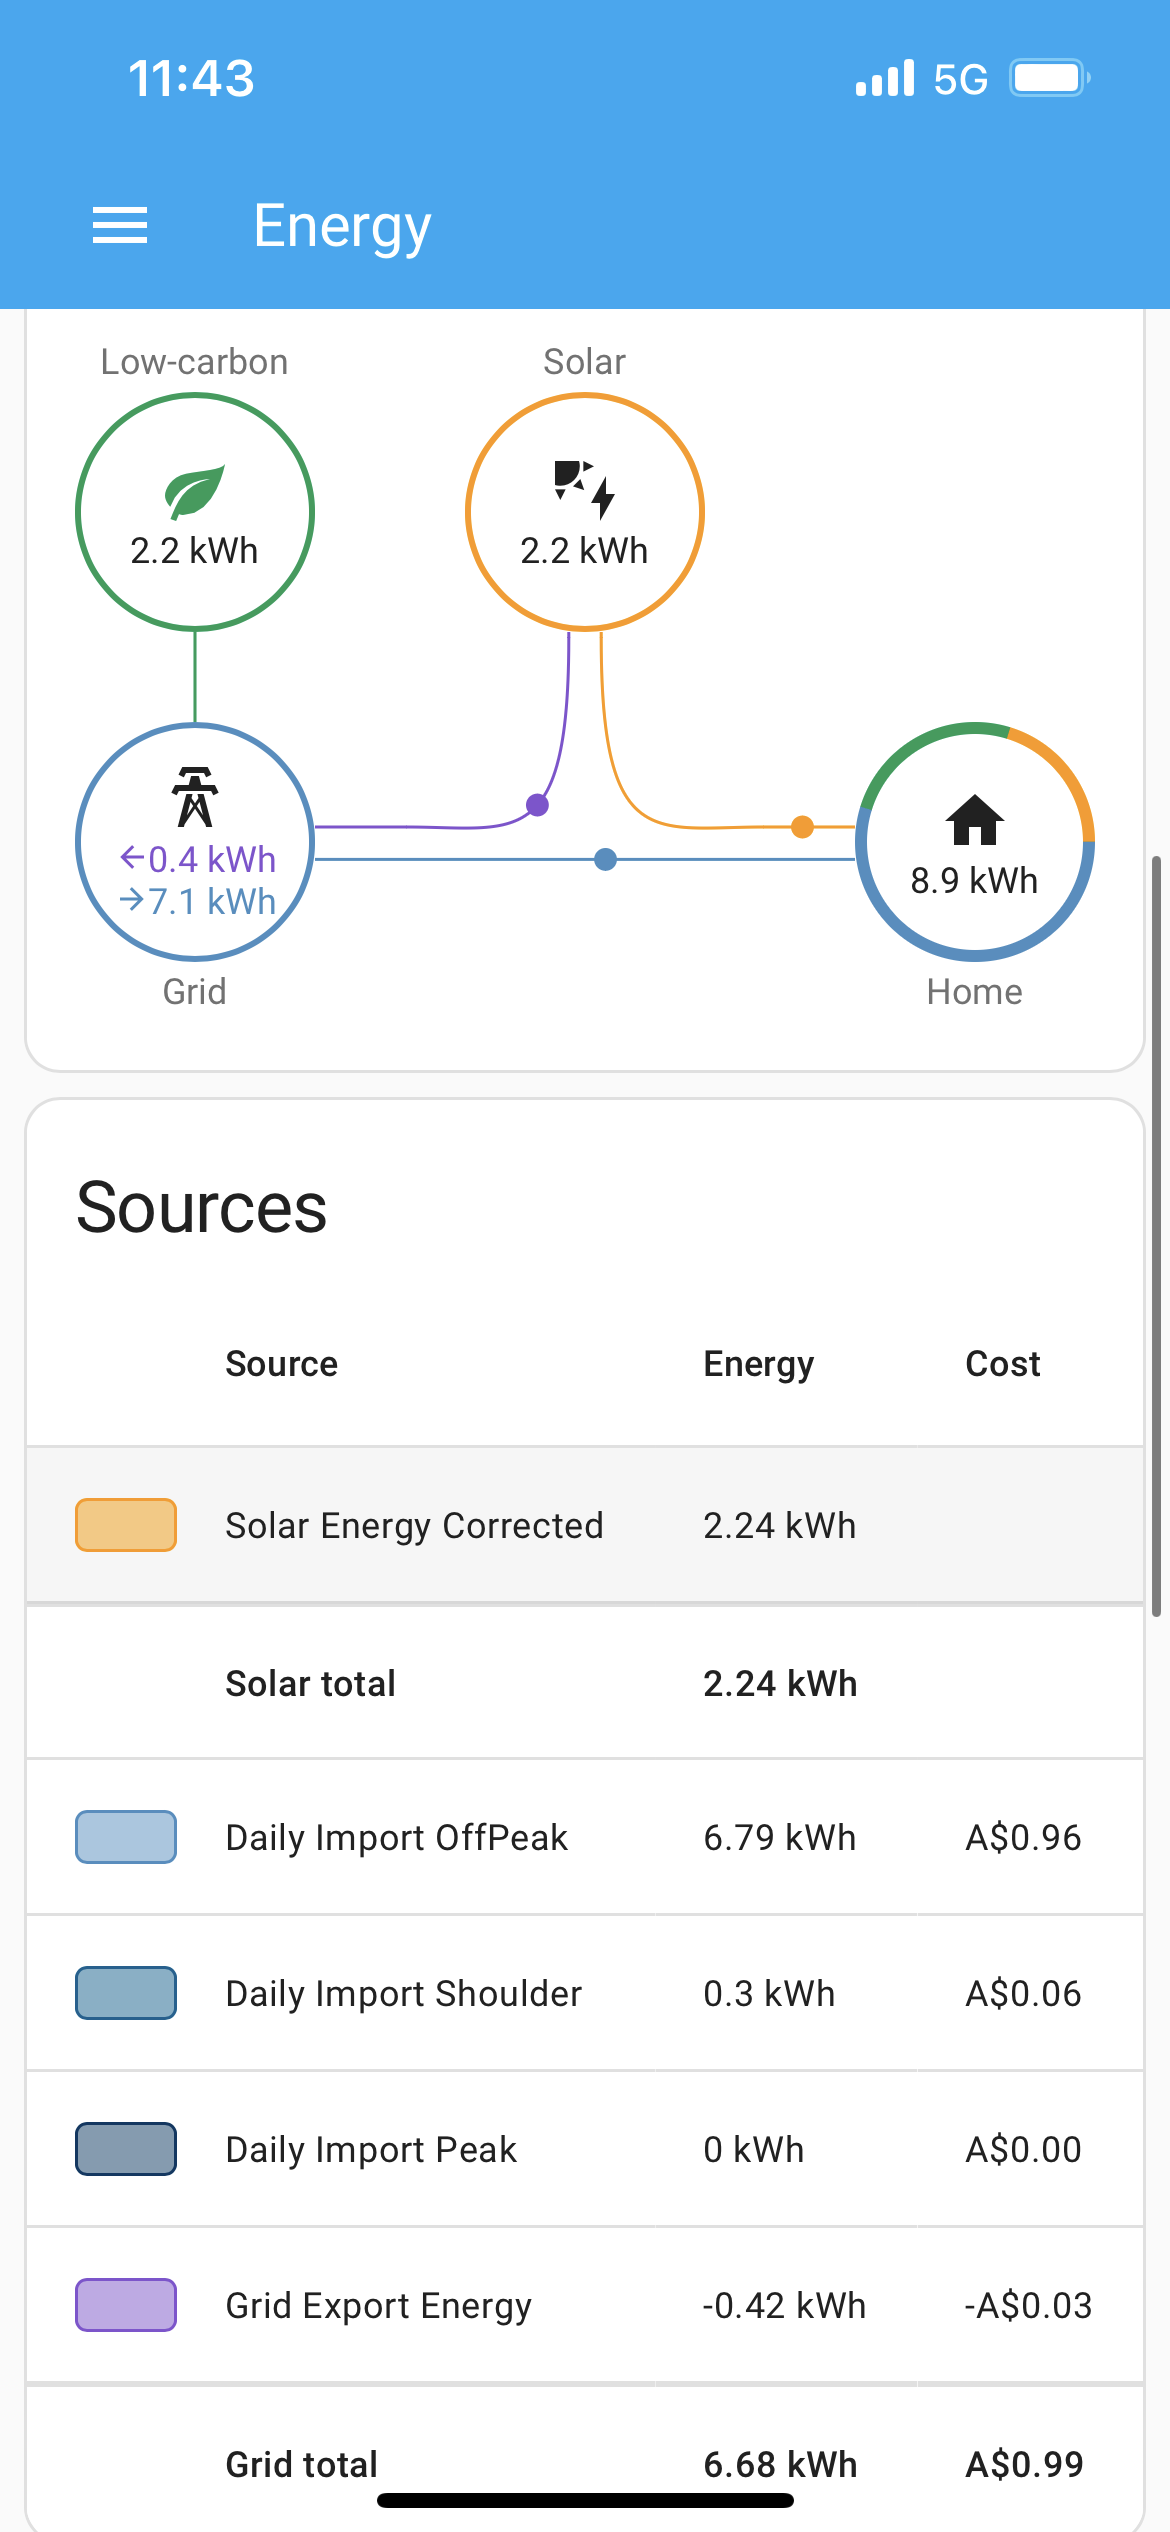
As you can see the sensor “sensor.house_power_consumption” is zero. This is telling me that I am not importing any power from the grid, that is, the LED1 is not flashing. The LED1 only flashes every 1watt hour when I am importing power.

However, "sensor.power_usage_3097"derived from the Efergy Integration and this sensor is actually a CT clamp on the consumption cable(s) in my Switchboard (uploaded to my Energyhive device via 433MHZ and stored in the UK) and this is what it is currently showing, 2915 W. This I believe is Total consumption of the house at time of screen dump.

image

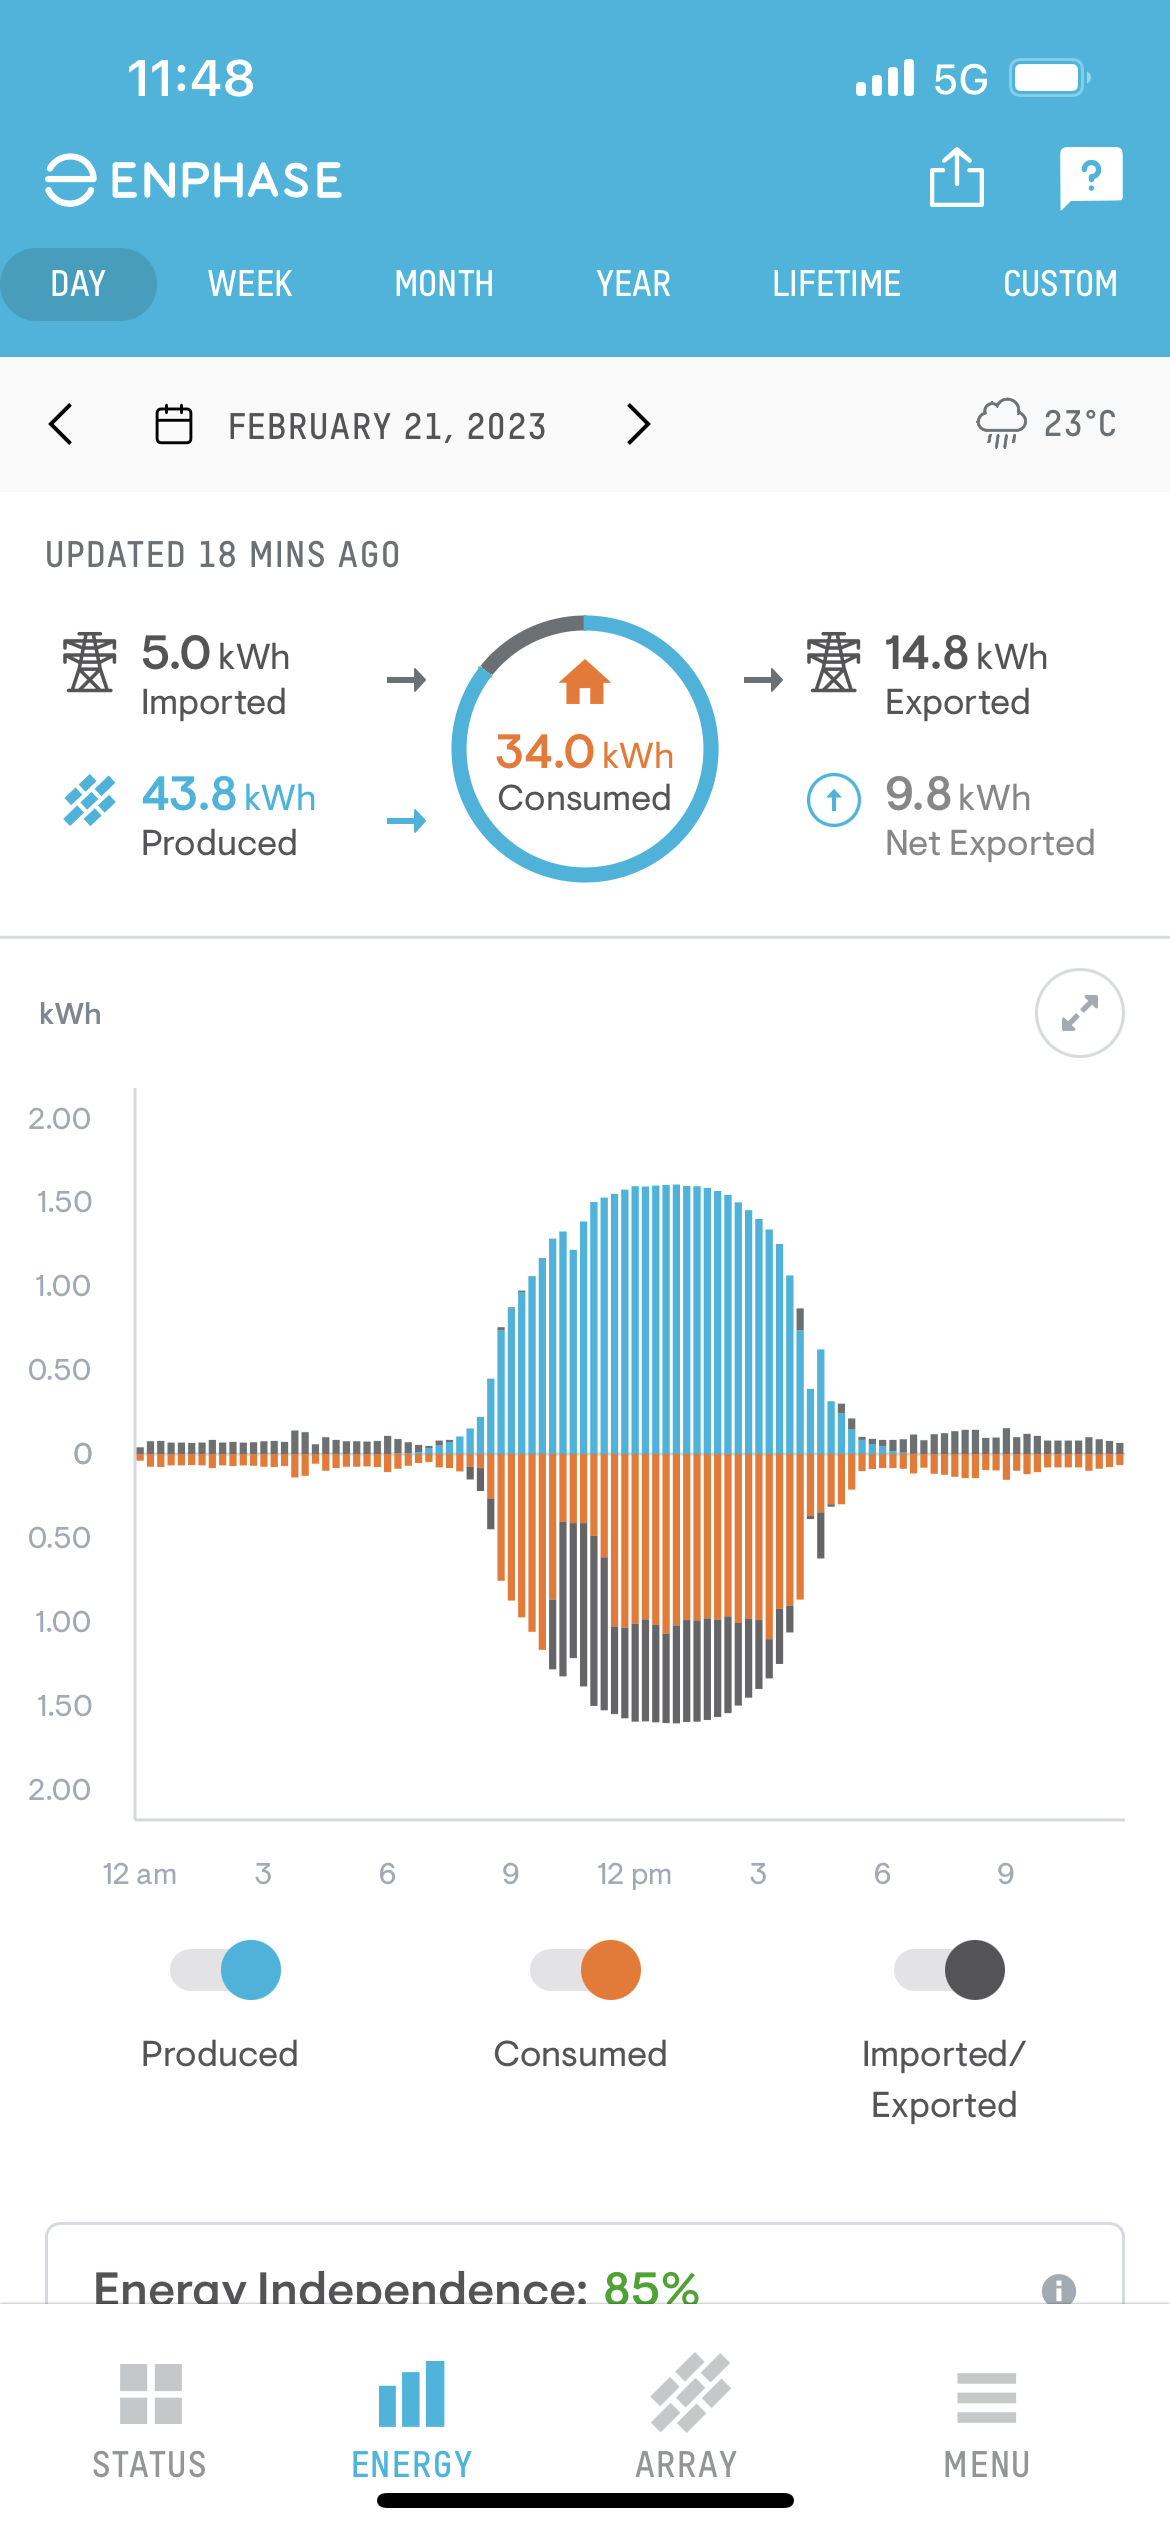
This is today’s Solar production in wh
image

I cannot make sense of it just yet!
Hoping you can shed some light. My yaml skills are not good. I can sort of read and understand but that’s about it.

Ian,
In my efforts to try an understand what is happening I came across this in discussions on the project in github

The last comment I think explains it all from klaasnicolaas the maintainer
“It will not really work with 1 LED, your meter will probably calculate what goes in and out and determines the behavior of your pulse LED based on that”

From the documentation on my meter

• LED1: 1 pulse = 1 watt hour export (to customer)
• LED2: 1 pulse = 1 watt hour import (from customer)

This said I think that this project will not work on a house with PV(Solar.)
I have LED2 but the code supplied does not cater for PV in it’s current form.
In my opinion, to read LED2 would require a 2nd setup and a different set of code.

I have completely misunderstood this project.
I have opened an issue on GitHub

Hi, before I installed solar, I used to have a retail sold device called powerpal. See https://www.powerpal.net/
This device gave great visibility of consumption by reading how much energy my house was pulling from the grid by reading the flashing light on my smart meter. When solar was installed, this device became useless for me when the sun was shining so I removed it. My solar solution replaced the functionality of this led reader.

Since there hasn’t been any action with the core component in quite a while, I’ve submitted a PR to the popular custom component (the one that supports firmware 7+) briancmpbll/home_assistant_custom_envoy which adds these calculations that @del13r has been showing us - right into the component so we don’t have to use template sensors. :+1:

What are others using for Battery Discharge and charge?
I just got me an Emporia Vue to see if I cna monitor the battery that way.

Hi @vk2him,

Thanks for the work done :wink:

Is it just me or the Add-on to stream to MQTT is not working anymore with recent HA update ?
I had messages in HA about deprecated sensor :

The mqtt platform for the sensor integration does not support platform setup. Please remove it from your config.
December 20, 2022 at 10:12:16 AM – (ERROR) Sensor - message first occurred at December 20, 2022 at 10:12:16 AM and shows up 4 times
Manually configured MQTT sensor(s) found under platform key 'sensor', please move to the mqtt integration key, see https://www.home-assistant.io/integrations/sensor.mqtt/#new_format
December 20, 2022 at 10:12:10 AM – (ERROR) MQTT

@batkite ,

The add-on still works fine however you need to now use the new method of formatting the mqtt integration key within your configuration.yaml.

The old method that no longer works is :


sensor 24:
  - platform: mqtt
    state_topic: "/envoy/json"
    name: "mqtt_production"
    qos: 0
    unit_of_measurement: "W"
    value_template: '{% if is_state("sun.sun", "below_horizon")%}0{%else%}{{ value_json["production"]["ph-a"]["p"]  | float }}{%endif%}'
    state_class: measurement
    device_class: power

  - platform: mqtt
    state_topic: "/envoy/json"
    value_template: '{{ value_json["total-consumption"]["ph-a"]["p"] }}'
    name: "mqtt_consumption"
    qos: 0
    unit_of_measurement: "W"
    state_class: measurement
    device_class: power

  - platform: mqtt
    state_topic: "/envoy/json"
    name: "mqtt_power_factor"
    qos: 0
    unit_of_measurement: "%"
    value_template: '{{ value_json["total-consumption"]["ph-a"]["pf"] }}'
    state_class: measurement
    device_class: power_factor

  - platform: mqtt
    state_topic: "/envoy/json"
    name: "mqtt_voltage"
    qos: 0
    unit_of_measurement: "V"
    value_template: '{{ value_json["total-consumption"]["ph-a"]["v"] }}'
    state_class: measurement
    device_class: voltage

The above needs to be replaced with the new mqtt intgration method :

mqtt:
  sensor:
    - name: "mqtt_production"
      state_topic: "/envoy/json"
      qos: 0
      unit_of_measurement: "W"
      value_template: '{% if is_state("sun.sun", "below_horizon")%}0{%else%}{{ value_json["production"]["ph-a"]["p"]  | float }}{%endif%}'
      state_class: measurement
      device_class: power

    - name: "mqtt_consumption"
      state_topic: "/envoy/json"
      value_template: '{{ value_json["total-consumption"]["ph-a"]["p"] }}'
      qos: 0
      unit_of_measurement: "W"
      state_class: measurement
      device_class: power

    - name: "mqtt_power_factor"
      state_topic: "/envoy/json"
      qos: 0
      unit_of_measurement: "%"
      value_template: '{{ value_json["total-consumption"]["ph-a"]["pf"] }}'
      state_class: measurement
      device_class: power_factor

    - name: "mqtt_voltage"
      state_topic: "/envoy/json"
      qos: 0
      unit_of_measurement: "V"
      value_template: '{{ value_json["total-consumption"]["ph-a"]["v"] }}'
      state_class: measurement
      device_class: voltage

I’ll update the add-in documentation with this - thanks

I am using your PR and I see the sensors but my grid energy import and export are showing a constant 0.01 kWh, I don’t understand what I did wrong, its possible I am reading the wrong sensors, could you or someone running this PR show me what the proper sensors are in the dashboard settings section?
Edit: on second look i could not find the sensors you mentioned would be in there, I added the code from the first few posts but the sensors show unknown states

Hi,

I made the change and everything is back to normal.

Thanks a lot.

How do I edit metering configuration for Envoy in HASS?
The current meter clamps might (in principle) be installed to measure the

  • current at the load (solar attached at the utility side of the CT)
    or
  • current on the utility side (solar attached at the consumption node)
    It appears (looking at the power levels displayed in the Energy dashboard) that the solar power is added to the power displayed as the Grid and this isn’t my case.

Question: Where do I edit the configuration? I vaguely remember there was an “interview” during the initial set-up (where I apparently made a mistake). I would prefer editing the configuration rather than deleting and starting over. Thanks!

Hi Martin,

I am not aware that you can make any changes like that in HA to affect EnPhase. Those metering changes are all done in the Installers toolkit (which is freely available from the playstore) but you need the installer to grant you access to that, which he may not want to do without relinquishing his warranty to you…


Hi Chris,
Thanks for your reply. I have full access to Envoy - since I self installed and I am also running some py scripts off-line to hog data with something like 30 second granularity. Enphase is doing it’s thing and reporting believable data.


The issue is that the metering current transformers may be installed on either side: On the utility side (where it measures net delivery from/to utility (distinguished by the sign)) or on the consumption side where it reports what is consumed from both utility and solar (always in one direction)).
Either option is fine wit Envoy, you just tell it during initial configuration what is the metering scheme. However, HASS integration seems to assume the later and there seem to be no configuration option.
I spent few hours searching and found this was actually reported while back so I am not the only one facing this.
Issue link below.
Thanks - Martin

1 Like

Ok after stuffing around two days with this post which is awesome by the way I have decided to ask for help please.
Issues:

The error in the screenshots below. Code shows some array expected error but HA has no issues using it.
There is a statistics not defined error in second screenshot not sure what thats about
The total consumption is off 2-3 KW right now. Shows 6 ish and I have 8 something on the app
Like you I have daily supply charge and 1 rate for usage. May need assistance with it if you can guide me.

thanks

template:
  - sensor:
        name: Grid Import Power
        state_class: measurement
        icon: mdi:transmission-tower
        unit_of_measurement: W
        device_class: power
        state: >
            {{ [0, states('sensor.envoy_SN_current_power_consumption') | int - states('sensor.envoy_SN_current_power_production') | int ] | max }}

  - sensor:
        name: Grid Export Power
        state_class: measurement
        icon: mdi:transmission-tower
        unit_of_measurement: W
        device_class: power
        state: >
            {{ [0, states('sensor.envoy_SN_current_power_production') | int - states('sensor.envoy_SN_current_power_consumption') | int ] | max }}
            
  - sensor:
        name: Solar Power Corrected
        state_class: measurement
        icon: mdi:solar-panel
        unit_of_measurement: W
        device_class: power
        state: >
            {% set value = states('sensor.envoy_SN_current_power_consumption') | int %}
            {% if value  <= 5 %}
              0
            {% elif is_state("sun.sun","below_horizon") %} 
              0
            {%- else -%}
              {{ value }}
            {%- endif %}
                        
sensor:
  - platform: integration
    name: Grid Import Energy
    source: sensor.grid_import_power
    unit_prefix: k
    unit_time: h
    method: left
    
  - platform: integration
    name: Grid Export Energy
    source: sensor.grid_export_power
    unit_prefix: k
    unit_time: h
    method: left
            
utility_meter:
  daily_energy:
    source: sensor.grid_import_energy
    name: Daily Import Meter
    cycle: daily
    tariffs:
      - offpeak
      - shoulder
      - peak
  daily_energy_export:
    source: sensor.grid_export_energy
    name: Daily Export Meter
    cycle: daily
    tariffs:
      - buyback


Screenshot 2023-02-22 093955
Screenshot 2023-02-22 094031

Try changing int to int(0)

That might happen if you are attempting this for the first time at night as the grid export value will be 0 until the sun comes up and your panels start making more power than your house needs. Once the value goes above 0, it should correctly format accordingly and statistics should follow over an hour later.

Total consumption since when?
Since midnight or since the solar panels were installed?
Have the integration/energy sensors been setup less than 24 hours ago? If so, then that would explain the difference as the integration/energy sensor will only start recording from when it was setup onwards.

Here are 2 screenshots.

First one shows the native sensors from enphase. These are the daily figures from the ct clamp on the panels (production) and ct clamp on the house (consumption)

This screenshot will show the grid import and grid export for the day.

As oversimplified example, If your house is consuming the exact same amount of power that your panels are producing, then the grid in and out figures will be 0.

Do you mean all int to int(0)?

tried but that did not change. Think something to do with name: Grid_…

I also wanted to ask if you can add a snap of your Electricity grid and Solar Panels sensor for the graph

I have 3 power sensors.


template:

  - sensor:
        name: Solar Power Corrected
        state_class: measurement
        icon: mdi:solar-panel
        unit_of_measurement: W
        device_class: power
        state: >
            {% set value = states('sensor.envoy_SN_current_power_production') | int(0) %}
            {% if value  <= 5 -%}
              0
            {% elif is_state('sun.sun','below_horizon') %}
              0
            {%- else -%}
              {{ value }}
            {%- endif %}


  - sensor:
        name: Grid Import Power
        state_class: measurement
        icon: mdi:transmission-tower
        unit_of_measurement: W
        device_class: power
        state: >
            {{ [0, states('sensor.envoy_SN_current_power_consumption') | int(0) - states('sensor.solar_power_corrected') | int(0) ] | max }}

  - sensor:
        name: Grid Export Power
        state_class: measurement
        icon: mdi:transmission-tower
        unit_of_measurement: W
        device_class: power
        state: >
            {{ [0, states('sensor.solar_power_corrected') | int(0) - states('sensor.envoy_SN_current_power_consumption') | int(0) ] | max }}


then I have 3 matching integration sensors that record how much energy.

sensor:

  - platform: integration
    name: Solar Energy Corrected
    source: sensor.solar_power_corrected
    method: left
    unit_prefix: k
    unit_time: h

    
  - platform: integration
    name: Grid Import Energy
    source: sensor.grid_import_power
    method: left
    unit_prefix: k
    unit_time: h
    
  - platform: integration
    name: Grid Export Energy
    source: sensor.grid_export_power
    method: left
    unit_prefix: k
    unit_time: h

sorry I meant the pic of your

The grid import figure is incorrect if I believe my app

which shows this

Hi,

I asked this question before:

Have the integration/energy sensors been setup less than 24 hours ago?

As for figures.

Enphase enlighten data is updated every 15 minutes.

And home assistant statistics which are used by energy dashboard are computed every hour which means they are delayed by up to an hour.

To get a better idea of accuracy, it’s best to check the daily totals for the day before.

1 Like

yup setup less than 24 hours

Day before matches for total consumption but day before yesterday it does not. I guess I’ll leave it for a day running and see what is like. I assume the error in the code I should not worry too much since HA checks out ok?
I do want to update the data 5min intervals but dont understand where the code needs updating? Sorry newbee

Basically your post here is hard to understand as to where this edit needs to be made…where am I putting the updated code for the card?

Ah, well behind the scenes, the original power sensors from the envoy are updated every minute. You can see this when looking at the original sensor.

The integration/energy sensors follow the source sensors and update whenever the source sensors are updated.

As for apexcharts that replicate the look of the enphase app, I’ll post my current config yaml here:

To draw the grey area, I had to add a net power sensor:

template:
  - sensor:
      - name: Net Power
        state_class: measurement
        unit_of_measurement: W
        device_class: power
        icon: mdi:transmission-tower
        state: >
          {% set production = states('sensor.solar_power_corrected') | int(0) %}
          {% set consumption = states('sensor.envoy_SN_current_power_consumption') | int(0) %}
          {{ (production - consumption) }}

Then in the edit dashboard, add card, custom: apex cards chart, card config section of the dashboard I did this:


type: custom:apexcharts-card
graph_span: 24h
stacked: true
header:
  show: true
  title: Total Power
series:
  - entity: sensor.solar_power_corrected
    type: column
    name: Produced
    color: '#01B4DE'
    group_by:
      func: avg
      duration: 5min
  - entity: sensor.envoy_SN_current_power_consumption
    transform: return x *-1 ;
    type: column
    name: Consumed
    color: '#F37320'
    group_by:
      func: avg
      duration: 5min
  - entity: sensor.net_power
    type: column
    name: Imported/Exported
    transform: return x *-1 ;
    color: '#545456'
    group_by:
      func: avg
      duration: 5min

The duration field is only used to choose how granular/thick to draw the column of data in the graph. The duration field has no effect on how often home assistant records the data.

End result is this

Keeping in mind that this view is only charting the consumption and production and net power sensors in W or KW

If you meant grid import and grid export energy figures in Wh or KWh, then they are also updated every minute at the least, but if it’s night time then the grid export sensor won’t update till the sun comes up and energy starts being sold to the grid.